THIS IS AN ARCHIVED VERSION OF CRA'S WEBSITE. THIS ARCHIVE IS AVAILABLE TO PROVIDE HISTORICAL CONTENT.
PLEASE VISIT HTTP://WWW.CRA.ORG FOR THE LATEST INFORMATION
| About CRA |
| Membership |
| CRA for Students |
| CRA for Faculty |
| CRA-Women |
| Computing Community Consortium (CCC) |
| Awards |
| Projects |
| Events |
| Jobs |
| Government Affairs |
| Computing Research Policy Blog |
| Publications |
| Data & Resources |
| CRA Bulletin |
| What's New |
| Contact |
| Home |
Back to March 2002 CRN Table of Contents
[Published originally in the March 2002 edition of Computing Research News, pp. 4-11.]
2000-2001 Taulbee Survey
Hope for More Balance in Supply and Demand
By Randal E. Bryant and Moshe Y. Vardi
This article and the accompanying tables present the results of the 31st annual CRA Taulbee Survey1 of Ph.D.-granting departments of computer science (CS) and computer engineering (CE) in the United States and Canada. This survey is conducted annually by the Computing Research Association to document trends in student enrollment, employment of graduates, and faculty salaries.
Information is gathered during the fall and early winter. The period the data cover varies from table to table. Degree production (Ph.D., Master’s, and Bachelor’s) and total Bachelor's, Master's and Ph.D. enrollments refer to the previous academic year (2000-2001). Data for new students in all categories refer to the current academic year (2001-2002). Projected student production and information on faculty salaries and demographics also refer to the current academic year. Faculty salaries are those effective January 1, 2002. Responses received by January 14, 2002 are included in the tables.
The data were collected from Ph.D.-granting departments only. A total of 215 departments were surveyed, compared with 214 departments last year. As shown in Figure 1, 173 departments returned their survey forms, for a response rate of 80 percent (compared with 81 percent last year). The return rate of 8 out of 28 (29%) for Computer Engineering (CE) programs is very low, although an improvement over recent years. We attribute this low response to two factors: 1) many CE programs are part of an ECE department, and they do not keep separate statistics for CE vs. EE; and 2) many of these departments are not aware of the Taulbee Survey or its importance. The response rates for US CS programs (142 of 164, or 87%) was very good, and the 100 percent response rate for Canadian programs is especially gratifying. We thank all respondents who completed this year’s questionnaire. Departments that participated are listed at the end of this article.
Due to the low return rate for CE, we caution against drawing strong conclusions from the data presented for CE. In our discussion, we will focus on the combined numbers for CS and CE. Because of changes in the departments that respond from one year to the next, we must approach any trend analysis with caution.
Figure 1. Number of Respondents to Faculty Salary Questions
|
Year |
US CS Depts. |
US CE Depts. |
Canadian |
Total |
|
1995 |
110/133 (83%) |
9/13 (69%) |
11/16 (69%) |
130/162 (80%) |
|
1996 |
98/131 (75%) |
8/13 (62%) |
9/16 (56%) |
115/160 (72%) |
|
1997 |
111/133 (83%) |
6/13 (46%) |
13/17 (76%) |
130/163 (80%) |
|
1998 |
122/145 (84%) |
7/19 (37%) |
12/18 (67%) |
141/182 (77%) |
|
1999 |
132/156 (85%) |
5/24 (21%) |
19/23 (83%) |
156/203 (77%) |
|
2000 |
148/163 (91%) |
6/28 (21%) |
19/23 (83%) |
173/214 (81%) |
|
2001 |
142/164 (87%) |
8/28 (29%) |
23/23 (100%) |
173/215 (80%) |
For more details on how the faculty salary information is to be interpreted, see the article in the January 2002, CRN on Preliminary Taulbee Faculty Salary Data (http://www.cra.org/CRN/issues/0201.pdf). [Note: In the printed version of the January article, in Table 1, the column reporting the number of faculty in each category was incorrect (the five entries should have been 563, 761, 832, 1197, and 3353). These have been corrected in the online version of the January CRN. Table 27 in the current edition presents the corrected counts, incorporating numbers from 13 additional departments.
The survey form itself is modified slightly each year to ensure as high a rate of return as possible (by simplifying and clarifying), while continuing to capture the data necessary to understand trends in the discipline and also reflect changing concerns of the computing research community. This year we added three new questions to obtain data previously collected on a separate departmental profiles survey. We decided to move these questions into the Taulbee because 1) the data should be updated annually (the profiles survey is only conducted every 3 years), and 2) the response rate on the profiles survey has historically been low. The three new questions address external research support and graduate student funding (Tables 24-26)
Ph.D. Degree Production and Enrollments (Tables 1-8)
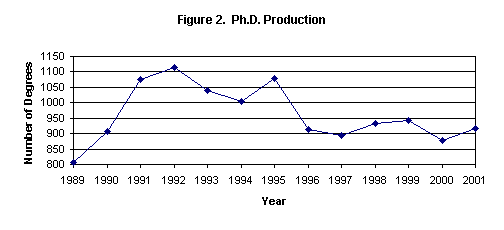
As shown in Table 1, a total of 912 Ph.D. degrees were awarded in 2001 by the 173 responding departments. As Figure 2 indicates, this is a slight (4%) improvement over last year’s 881, which was the lowest number in more than 10 years. Note, however, that some of this apparent increase could be due to shifts in the departments that responded to the survey.

The prediction from last year’s survey that 1,144 Ph.D. degrees would be awarded in 2001 was, as usual, overly optimistic, with an “optimism” ratio, defined as the actual over the predicted, being 0.80. Given next year’s prediction of 1,205 graduates, we predict the actual number will be between 906 and 1,015.
All other numbers indicate a strong growth in the Ph.D. supply in the next few years. The number who entered Ph.D. programs (Table 5) increased from 2,062 to 2,702 (31%). The number who passed qualifiers (Table 1) increased from 1,119 to 1,244 (11%), and the number who passed their thesis proposal exams (Table 1) increased from 788 to 917 (16%). The total Ph.D. enrollments (Table 6) increased from 7,857 to 8,810 (12%). Looking beyond our survey results, some CS programs are reporting record numbers of applicants for their Ph.D. programs this year. It seems that the failure of the dot-com boom has convinced many recent Bachelor’s and Master’s degree recipients to return to graduate school.
Table 4 shows area of specialization versus types of first appointments for Ph.D. recipients in 2001. These statistics are also very similar to those from last year. There seems to be a slight shift from core areas of computer science (programming languages and theory) toward more applied areas (scientific computing, graphics, human interface, databases, and information systems), but the large number (202/933) whose specialization is uncategorized makes it risky to draw any strong conclusions.

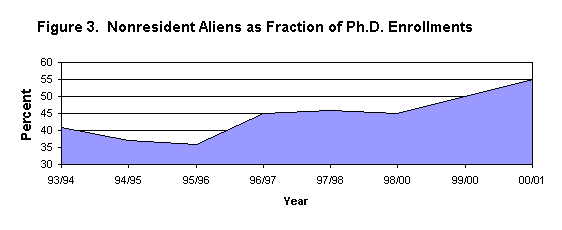
Most statistics on gender and ethnicity for Ph.D. students (Tables 2, 3, 7, 8) show remarkably little change from last year. White and nonresident alien men continue to account for a very large fraction of our Ph.D. production and enrollments. Women constitute a significant minority (19% of enrollments, 16% of graduates.) All other underrepresented groups are very small minorities. As Figure 3 illustrates, we see a continuing increase in the proportion of enrolled Ph.D. students who are nonresident aliens.
Master’s and Bachelor’s Degree Production and Enrollments (Tables 9-16)
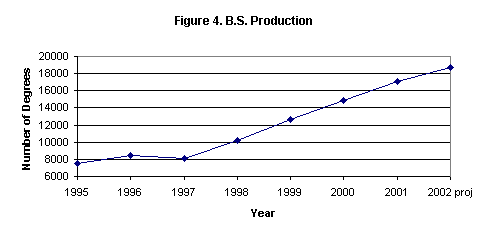
Almost all statistics on Master’s and Bachelor’s programs show major growth. Master’s degrees were awarded to 8,266 students, an increase of 26 percent. Bachelor’s degrees numbered 17,048, an increase of 15 percent. This year’s Master’s production exceeded the projection from last year’s survey by 31 percent, while Bachelor’s production exceeded projections by 7 percent. If this trend continues, then next year’s projected production of 18,695 Bachelor’s degrees (Table 11 and Figure 4) and 7,341 Master’s degrees (Table 12) may be too low.

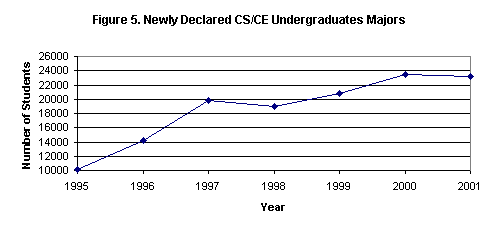
The number of new undergraduates actually dropped slightly from 23,416 to 23,090 (1%) (see Figure 5), in contrast with significant increases in recent years. As yet, we cannot determine whether this was simply an artifact of the changes in the departments reporting, or the start of a new trend. Perhaps the decline in the technology industry is making computer science and engineering less alluring to new undergraduates. In addition, some programs may be operating in “saturation” mode, where they simply cannot accept more undergraduate majors given their teaching resources.
 |
In all other numbers, we see growth in both Bachelor’s and Master’s programs. New Master’s students (Table 13) increased by 22 percent, total enrollments in Bachelor’s programs increased by 8%, and enrollments in Master’s programs increased by 10%.
Most demographics regarding gender and ethnicity for Bachelor’s and Master’s students show remarkable stability from last year. As with Ph.D. recipients, the proportion of Master’s degree recipients who are nonresident aliens continually climbs, from 52 percent last year to 57 percent this year.
Faculty Demographics (Tables 17-23)
The total number of faculty increased by 8 percent over the past year to a total of 5,344. These increases came in all categories, with an especially large (60%) increase in postdocs. Considering that 140 faculty are reported to have left academia (Table 23), the survey indicates 759 new faculty this year. Our Ph.D. production shows only 326 graduates taking faculty positions (Table 4). Some of the new teaching faculty may not have Ph.D. degrees, and some new faculty may have come from nonacademic sources. There is some influx of existing Ph.D. holders into academia as industrial labs are being downsized and reorganized.
This year’s faculty growth to 5,344 was slightly less than the prediction of 5,465 from last year’s survey. Still, this indicates that departments generally met their faculty recruiting targets. The planned two-year growth rate of 21 percent is the same as last year. Last year they predicted growing to 5,966 for 2002-2003, but this year they have adjusted the prediction for the same time period to 5,613. Last year we observed that the planned growth targets were unrealistically aggressive, compared with the predicted supply of new Ph.D.s. This year, the combination of increasing supply and decreasing targets makes the recruiting objectives seem more feasible.
Table 23 on faculty “losses” showed that a large number took academic positions elsewhere. Only 140 (2.6% of total faculty) actually left academia through death, retirement, or taking a nonacademic position. This compares with 115 (2.3% of total faculty) last year. Overall, the rate of departures over the past few years has remained within the very stable range of between 2.3 percent and 2.6 percent.
The demographic data for faculty (Tables 19–22) are very similar to those from last year. We see that the gender split of new faculty (83% male, 17% female) is very close to the split for new Ph.D. recipients (Table 2). There is some skew in the distribution, with somewhat more men in tenure-track (85%) and research (87%) positions, and somewhat more women in teaching and other (both 22%) positions, but these numbers are actually somewhat more balanced than in previous years.
It is interesting to compare the ethnicity data for new faculty (Table 20) with that of Ph.D. recipients (Table 3). Fully 60 percent of the new faculty are white, non-Hispanic, even though only 38 percent of the Ph.D. recipients are in this category. By contrast, only 17 percent of the new faculty are nonresident aliens, whereas fully 46 percent of the degree recipients are in that category. Some new faculty could have become residents after receiving their Ph.D. degrees, but it seems clear that proportionately fewer foreign students take positions at U.S. universities.
Research Expenditures and Graduate Student Support (Tables 24-26)
As mentioned earlier, we added three new questions to the Taulbee Survey this year, incorporating key data that previously have been collected as part of a separate departmental profiles survey.
The first question asked: “For the most recently completed fiscal year, what was the department’s total expenditure (including indirect costs or “overhead” as stated on project budgets) from external sources of support for Computer Science/Engineering research?” The results are reported in Table 24, showing both absolute and per-capita numbers, where capitation is computed relative to the number of tenured and tenure-track faculty members. Canadian levels are shown in Canadian dollars. The data show a clear correlation between ranking and per-capita expenditures, although this correlation holds only between ranking bands (1-12, 13-24, etc.) and per-capita expenditures. As expected, Canadian departments show a lower level of expenditures from external sources, stemming, no doubt, from the different way that research is funded in Canada. Computer engineering departments also show a lower level of expenditures from external sources, but no conclusion can be drawn due to the low response rate of computer engineering departments.
The second question asked departments to: “provide the number of graduate students supported as full-time students as of fall 2001,” further categorized as teaching assistants, research assistants, fellows, or computer systems' supporters, and split between those on institutional vs. external funds. The results are shown in Table 25. Overall, we can see that the higher ranked schools are able to support more students with research positions through research assistantships and fellowships, while the other schools rely more on teaching assistantships to support their students. Canadian schools also have a high proportion (49%) of students supported via teaching assistantships. The number supported for computer systems support is very small.
The third question asked respondents to “provide the net amount (as of fall 2001) of an academic-year stipend for a graduate student (not including tuition or fees).” The results are shown in Table 26. Canadian stipends are shown in Canadian dollars. The numbers suggest a gap between departments in the top two ranking bands and departments in lower bands in all categories of graduate-student support.
Faculty Salaries (Tables 27-34)
The U.S. average salaries have increased by 5 percent to 7 percent for different categories of U.S. faculty, similar to last year. Canadian salaries (shown as 12-month salaries in Canadian dollars) for tenure-track faculty also increased by 5 to 7 percent for the different categories. Salaries for non-tenure-track teaching faculty show a much greater increase (20%). These numbers are skewed by the presence of one highly paid lecturer at a school with only one such employee; nevertheless, there is evidence of significant salary increases at other institutions.
Concluding Observations
Overall, signs indicate a continued growth in graduate (both Master’s and Ph.D.) programs in computer science and engineering. Although the Ph.D. output rose only slightly this year, it appears there will be a significant increase over the next few years. The growth at the Bachelor’s level has diminished compared with recent years, with even a slight decrease in the number of newly declared majors. It is still too early to tell whether this is the start of a trend toward declining undergraduate enrollments (as has happened at other times during downturns in the technology economy), whether it simply indicates that many programs are operating at full capacity and cannot expand further, or whether it is just an artifact of the shifting departments responding to our survey.
Rankings
For tables that group computer science departments by rank, the rankings are based on information collected in the 1995 assessment of research and doctorate programs in the United States conducted by the National Research Council.
The top twelve schools in this ranking are: Stanford, Massachusetts Institute of Technology, University of California (Berkeley), Carnegie Mellon, Cornell, Princeton, University of Texas (Austin), University of Illinois (Urbana-Champaign), University of Washington, University of Wisconsin (Madison), Harvard, and California Institute of Technology. All schools in this ranking participated in the survey this year
CS departments ranked 13-24 are: Brown, Yale, University of California (Los Angeles), University of Maryland (College Park), New York University, University of Massachusetts (Amherst), Rice, University of Southern California, University of Michigan, University of California (San Diego), Columbia, and University of Pennsylvania.2 All schools in this ranking participated in the survey this year.
CS departments ranked 25-36 are: University of Chicago, Purdue, Rutgers, Duke, University of North Carolina (Chapel Hill), University of Rochester, State University of New York (Stony Brook), Georgia Institute of Technology, University of Arizona, University of California (Irvine), University of Virginia, and Indiana. All schools in this ranking participated in the survey this year.
CS departments that are ranked above 36 or that are unranked that responded to the survey include: Arizona State University, Auburn, Boston, Brandeis, Case Western Reserve, City University of New York, Clemson, William and Mary, Colorado State, Dartmouth, DePaul, Florida Institute of Technology, Florida International, Florida State, George Mason, Georgia State, Illinois Institute of Technology, Iowa State, Johns Hopkins, Kansas State, Kent State, Louisiana State, Michigan State, Michigan Technological, Mississippi State, New Jersey Institute of Technology, New Mexico State, North Carolina State, North Dakota State, Northeastern, Oakland, Ohio State, Ohio University, Oklahoma State, Old Dominion, Oregon Health & Science, Oregon State, Pennsylvania State, Polytechnic, Portland State, Rensselaer Polytechnic, Southern Methodist, State University of New York (Albany, Binghamton, and Buffalo), Stevens Institute, Syracuse, Temple, Texas A&M, Texas Tech, Tufts, Vanderbilt, Virginia Polytechnic, Washington State, Washington (St. Louis), Wayne State, West Virginia, Western Michigan, Worcester Polytechnic, and Wright State.
University of: Alabama (Birmingham, Huntsville, and Tuscaloosa), Arkansas, California (Davis, Santa Barbara, and Santa Cruz), Cincinnati, Colorado (Boulder and Colorado Springs), Connecticut, Delaware, Denver, Florida, Georgia, Hawaii, Houston, Idaho, Illinois (Chicago), Iowa, Kansas, Kentucky, Louisiana (Lafayette), Maine, Maryland (Baltimore Co.), Massachusetts (Lowell), Minnesota, Missouri (Rolla and Columbia), Nebraska (Lincoln), Nevada (Las Vegas), New Hampshire, New Mexico, North Texas, Notre Dame, Oklahoma, Oregon, Pittsburgh, South Carolina, South Florida, Tennessee (Knoxville), Texas (Arlington and Dallas), Utah, Wisconsin (Milwaukee), and Wyoming.
Computer Engineering departments participating in the survey this year include: Georgia Institute of Technology, Northwestern, Oregon State, Purdue, Rensselaer Polytechnic, Santa Clara, University of California (Santa Cruz), and the University of New Mexico.
Canadian departments participating in the survey include: Carleton, Concordia, Dalhousie, McGill, Memorial, Queen's, Simon Fraser, and York universities. University of: Alberta, British Columbia, Calgary, Manitoba, Montreal, New Brunswick, Ottawa, Quebec (Montreal), Regina, Saskatchewan, Toronto (CS and ECE), Victoria, Waterloo, and Western Ontario.
Acknowledgments
Jean Smith, Patrick McMullen, and Bill Aspray assisted with the data collection, tabulation, and analysis for this survey. We thank them for their assistance. Stu Zweben participated in the discussion of the analysis, and provided useful suggestions for this document.
Endnotes
1The title of the survey honors the late Orrin E. Taulbee of the University of Pittsburgh, who conducted these surveys for the Computer Science Board until 1984, with retrospective annual data going back to 1970.
2Although the University of Pennsylvania and the University of Chicago were tied in the National Research Council rankings, CRA made the arbitrary decision to place Pennsylvania in the second tier of schools.
All tables with rankings: Statistics sometimes are given according to departmental rank. Schools are ranked only if they offer a CS degree and according to the quality of their CS program as determined by reputation. Those that only offer CE degrees are not ranked, and statistics are given on a separate line, apart from the rankings
All ethnicity tables: Ethnic breakdowns are drawn from guidelines set forth by the U.S. Department of Education.
All faculty tables: The survey makes no distinction between faculty specializing in CS vs. CE programs. Every effort is made to minimize the inclusion of faculty in electrical engineering who are not computer engineers.
Copyright © 2007 Computing Research Association. All Rights Reserved. Questions? E-mail: webmaster@cra.org.
