| About CRA |
| CRA for Students |
| CRA for Faculty |
| Events |
| Jobs |
| Government Affairs |
| Computing Research Blog |
| CRA-Women |
| Projects |
| Publications |
| Data & Resources |
| Membership |
| What's New |
|
Home |

Ph.D. Enrollment Up for the Third Straight Year
| Date: | March 1999 |
| Section: | CRA Taulbee Survey |
This article and the accompanying tables present the results of the 28th annual CRA Taulbee Survey 1 of Ph.D. granting departments of computer science (CS) and computer engineering (CE) in the United States and Canada. This survey is conducted annually by CRA to document trends in student enrollment, employment of graduates, and faculty salaries. Information is gathered during the fall and early winter. Responses received by January 20, 1999 are included in the tables.
The survey results are from Ph.D. granting departments only. One hundred and eighty-six departments were surveyed. Information on degree production (Ph.D., Master's, and Bachelor's) and enrollment (Ph.D.) applies to the previous academic year (1997-98). New students in all categories and total enrollments for Master's and Bachelor's refer to the current academic year (1998-99). Projected production refers to the current academic year as well. Information on faculty salaries and demographics also applies to the current academic year. Faculty salaries are those effective January 1, 1999.2
This article presents the most significant results of the survey, with particular attention to those that differ markedly from last year or that appear to indicate long-term trends.
This year 144 departments submitted surveys -- 144 responded to the Ph.D. section, 140 to the Master's section, and 138 to the Bachelor's section. All 144 departments provided faculty information. The response rate was 77%, down slightly from last year's rate of 80%; however, the overall number of departments responding this year was higher (144 versus 135). We thank all respondents who completed the questionnaire.
Two new questions were added to the survey this year. One requested the average number of years to receive a Ph.D.(5.014). The second asked for the number of positions left unfilled last year in the following categories: tenure-track (156), researcher (0), post-doc (5), lecturer (9), instructor (8), other (4). We expect to use this additional data in a long-term longitudinal analysis.
Degree Production
 |
Figure 1 |
Table 4 shows areas of specialization versus types of first appointments for last year's Ph.D. recipients. The breakdown is quite similar to last year with no discernable new patterns.
As predicted, the explosive growth in undergraduate enrollments over the past two years has begun to translate into a significant increase in the number of new Bachelor's degrees awarded. There were 10,161 awarded in 1998 by the 138 responding departments, up 26% from the 8,063 awarded by the 129 responding departments in 1997. The number of Master's degrees, which was essentially flat between 1995 and 1996 with 130 departments reporting, rose about 4.3% in 1997 with 131 departments reporting, and rose again about 11.1% in 1998 with 140 departments reporting.
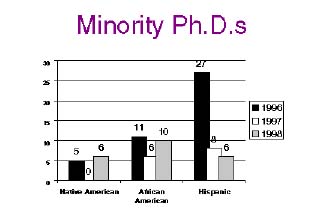 |
Figure 2 |
Last year we noted an alarming drop in the number of Ph.D. degrees awarded to Native Americans (from 5 in 1996 to 0 in 1997), African Americans (from 11 in 1996 to 6 in 1997), and Hispanics (from 27 in 1996 to 8 in 1997). This year these trends were reversed in the first two categories, but not in the last: there were only 6 Ph.D. degrees awarded to Hispanics in 1998 (Figure 2).
Student Enrollment
(Tables 7-14)New enrollment in Ph.D. programs is up significantly this year: 1,780 in Fall 1998, up 23.6% from 1,440 in Fall 1997. This is the third straight year of increase, indicating a sustained trend. These numbers bode well for a long-term increase in Ph.D. production. Total enrollment in Ph.D. programs is 7,119, up 4.86% from 6,789 last year. New enrollment in Master's degree programs shows a similar gain from 3,410 in 1997 to 4,223 in 1998, an increase of 23.8%.
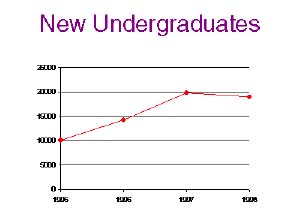 |
Figure 3 |
The percentage of women enrolled in Ph.D. programs has shown a gradual but steady increase over the past three years: 16.2% in 1996, 17.0% in 1997, 18.8% in 1998. There were no significant changes in the ethnicity of Ph.D. students.
Faculty Demographics
In 1998, about 10.8% of professors were women, up slightly from 10.2% in 1997. Although this is not much of a change, women have shown significant gains in seniority. For men, the percentage of tenure-track faculty who were associate or full professors was 79.9% in 1996, 82.2% in 1997, and 81.0% in 1998, essentially a steady state. Women, on the other hand, went from 58.0% in 1996 to 61.6% in 1997 to 69.1% in 1998.
Faculty Salaries
Average salaries at U.S. institutions rose 3.7-4.8% with the smallest increase at the full professor level and the largest at the associate professor level (Table 30). This is slightly higher than last year. Canadian salaries posted more modest 3.9% and 2.2% increases at the assistant and associate professor levels, respectively, and actually dropped 0.6% at the full professor level (Table 32). Salaries for U.S. institutions are 9-month salaries and are reported in U.S. dollars; those for Canadian institutions are 12-month salaries and are reported in Canadian dollars.
The salary figures in the first column of Table 25, which appear to be inverted, are correct. This phenomenon was also observed last year.
The overall mean salaries reported in the center column in Tables 24-32 are unweighted means, calculated by averaging the mean salaries as reported by each department. They are not weighted by the number of CS & CE faculty at each institution.
Rankings
For tables that group computer science departments by rank, the rankings are based on information collected in the 1995 assessment of research and doctorate programs in the United States conducted by the National Research Council.
The top 12 schools in this ranking are Stanford University, the Massachusetts Institute of Technology, the University of California at Berkeley, Carnegie Mellon University, Cornell University, Princeton University, the University of Texas at Austin, the University of Illinois at Urbana-Champaign, the University of Washington, the University of Wisconsin at Madison, Harvard University, and the California Institute of Technology.
The departments ranked 13-24 are Brown University, Yale University, the University of California at Los Angeles, the University of Maryland at College Park, New York University, the University of Massachusetts at Amherst, Rice University, the University of Southern California, the University of Michigan, the University of California at San Diego, Columbia University, and the University of Pennsylvania. 3
The departments ranked 25-36 are the University of Chicago, Purdue University, Rutgers-the State University of New Jersey, Duke University, the University of North Carolina at Chapel Hill, the University of Rochester, the State University of New York at Stony Brook, the Georgia Institute of Technology, the University of Arizona, the University of California at Irvine, the University of Virginia, and Indiana University.
Acknowledgments
Stacy Cholewinski and Jean Smith assisted with the data collection. Stacy also handled the data tabulation and Jean helped follow up with the institutions. We thank them for their assistance.
Footnotes
In Table 1, the "Ph.D.s Produced" column shows the number of CS and CE degrees produced throughout the rankings. * Includes 35 CE degrees granted by these CS departments@ Includes 1 CE degree granted by these Canadian departments
# Includes 18 CS degrees granted by these CE departments
+ Includes 62 CE degrees granted by these CS departments
& Includes 20 CS degrees granted by these CE departments
1 The title of the survey honors the late Orrin E. Taulbee of the University of Pittsburgh, who conducted these surveys for the Computer Science Board from 1970 until 1984. 2 In some instances, departments only answered selective questions within a table or a section. Therefore, for individual fields within tables the response rate may vary + 3. 3Indicates that the percentage only totals 99. 4 Although the University of Pennsylvania and the University of Chicago were tied in the National Research Council rankings, CRA made the arbitrary decision to place Pennsylvania in the second tier of schools. All tables with rankings: Statistics sometimes are given according to departmental rank. Schools are ranked only if they offer a CS degree and according to the quality of their CS program as determined by reputation. Those that only offer CE degrees are not ranked, and statistics are given on a separate line, apart from the rankings. All ethnicity tables: Ethnic breakdowns are drawn from guidelines set forth by the U.S. Department of Education. All faculty tables: The survey makes no distinction between faculty specializing in CS versus CE programs. We tried to minimize inclusion of any faculty in electrical engineering.
