| About CRA |
| CRA for Students |
| CRA for Faculty |
| Events |
| Jobs |
| Government Affairs |
| Computing Research Blog |
| CRA-Women |
| Projects |
| Publications |
| Data & Resources |
| Membership |
| What's New |
|
Home |

1997-1998 CRA Departmental Profiles Survey
By Mirek Truszczynski and Stephen Seidman
| Date: | November 1998 |
| Section: | Profiles Survey |
In spring 1998, the Computing Research Association conducted a survey of U.S. and Canadian Ph.D. granting departments of computer science and engineering to collect data on budget, staff support, space, faculty teaching loads, and graduate student support. The survey asked for the data for the most recent annual period for which the data were available. In most cases this meant the period from July 1, 1996 to June 30, 1997. The results of the survey were reported in a workshop at the 1998 CRA Conference at Snowbird.
The survey was sent to 186 Ph.D. granting programs in computer science and computer engineering. The response rate for U.S. programs was 52.2%, with 89 out of 170 programs responding. The response rate for the Canadian programs was 50%, where 8 out of 16 programs responded.
When analyzing the results of the survey, we divided the U.S. programs into four groups according to the most recent NRC ranking: CS departments ranked 1 - 12 (7 responses), CS departments ranked 13 - 24 (9 responses), CS departments ranked 25 – 36 (9 responses), and CS departments ranked 37 or higher (60 responses including 4 not ranked by the NRC). In a different analysis, we divided the U.S. computer science and computer engineering programs into public (65 responses) or private (24 responses) institutions.
Some departments responding to the survey did not provide answers to all the questions. However, the proportion of missing values was small, only sporadically exceeding 10%. We believe that these response rates are sufficiently high for the aggregate results of the survey, presented below, to be meaningful.
Too few (four) computer engineering departments responded to the survey to allow us to report the results for this group separately and maintain the anonymity of the respondents.
Finally, we want to emphasize that this article presents only a statistical summary of the results of the survey. We did not attempt to give a detailed interpretation of the data for two reasons. First, there are significant differences among academic institutions in handling budgets, space, and personnel. We feel that although these differences are important, averaging over many responses decreases their effect and yields meaningful aggregate data. Second, since this was the first survey of its kind in many years, there is no temporal data to substantiate any conjectures about longitudinal trends.
*NOTE: You can view tables individually or as an entire set.
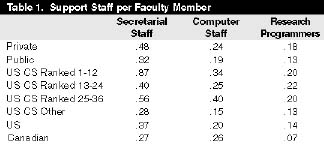
Support staff
Table 1 presents the average ratio of the number of secretaries, computer support staff, and research programmers to the number of full-time equivalent (FTE) faculty for all categories of programs. The results show that for the categories of secretarial support staff and research programmers, this ratio is higher for the U.S. programs than for the Canadian ones. The ratio is higher for the Canadian programs for computer support staff. Further, privately funded institutions have generally higher levels of staff support per FTE than institutions supported by public funds. Finally, the ratio of staff support is generally higher in top ranked departments.
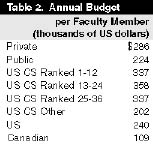
Budget
Table 2 presents the average ratio of annual department expenditures for the most recent complete fiscal year (in thousands of U.S. dollars) to the number of FTE faculty. (Please note that all Canadian dollars were converted to U.S. dollars for comparison and analysis.) Total expenditures include the regular departmental budget expenditures (salaries, including TA stipends, equipment purchases, and maintenance, and operating expenses), expenditures of funds from external grants and contracts and from discretionary accounts, and expenditures of overhead funds returned to the department. Total expenditures do not include the value of equipment donations. There are no significant differences between the three groups of top-ranked U.S. programs. However, the average expenditure per FTE in a U.S. program ranked 37 or higher is about 40% lower than the same average for programs ranked 1 – 36. There is also a striking difference between U.S. and Canadian programs, with the average expenditure per FTE in Canadian programs being more than 50% lower than in the United States.
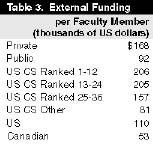
Table 3 summarizes the findings on the rate of external funding per faculty member. Unlike other results of the survey, there is a significant difference here between private and public institutions.
The rate of external funding is also higher in the U.S. than in Canada. It is also higher for top-ranked departments than for departments ranked 37 and higher.
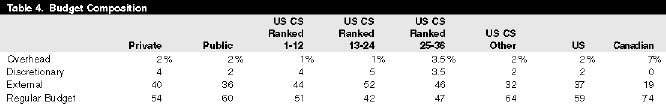
The survey also asked about the structure of the budget. These data are summarized in Table 4. The data show that external funding plays a smaller role in the budgets of the Canadian programs compared with the U.S. Similarly, the portion of the budget that comes from external funds in the U.S. departments ranked 37 and up is lower than in the programs ranked 1 - 36.
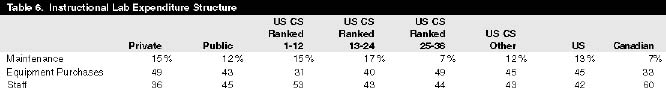
Table 5 presents the average ratio of annual departmental expenditures for instructional and research laboratories to the number of FTE faculty (in thousands of U.S. dollars). These expenditures include maintenance costs, equipment purchases, and personnel costs . The value of donated equipment is not included. It is noteworthy that the ratio for instructional laboratories is higher in Canada than in the U.S., but that the ratio for research laboratories is lower in Canada. Further, the per-FTE level of support for research laboratories in the U.S. departments ranked 1 - 36 is two to four times higher than for the remaining U.S. programs.
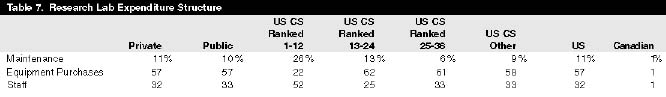
The survey also gathered data on the structure of expenditures for instructional and research laboratories. These data are presented in Tables 6 and 7. As might be expected, staff and equipment purchases predominate.
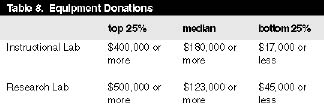
Equipment donations to instructional and research labs provide substantial support to many computer science programs. Thirty-four U.S. computer science programs reported donations of instructional equipment. The same number of U.S. computer science programs reported research equipment donations. The first quartile, median, and the third quartile of the estimated value of these donations are given in Table 8. Five Canadian programs (out of 8 responding to the survey) reported donations of instructional equipment with an estimated value ranging from $5,000 to $255,000. Three Canadian programs reported donations of research computing equipment.
Space
The survey asked about use of space in the departments. We found no clear trends as a function of type (public vs. private), ranking, or country. We thus report the average space use over all responses. The results are shown in Figure 1 below.
The survey indicates significant activity with respect to added or forthcoming space allocated to U.S. computer science departments. Out of 89 U.S. departments, 21 reported acquiring new space in the past year. The amount of new space ranged widely (minimum 41 sq. ft., median 1,600 sq. ft., maximum 8,690 sq. ft.). Five departments reported loss of space.
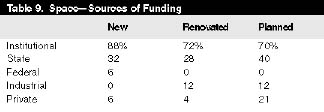
Twenty-five U.S. departments reported renovation of existing space. The scope of renovation differed substantially among programs (minimum 260 sq. ft., median 1,912 sq. ft., maximum 10,000 sq. ft.). The survey asked respondents to indicate funding sources for the newly acquired or renovated space. The results are shown in Table 9. Institutional and state funding were listed most often by far, with federal, industrial, and private funding being mentioned only sporadically.
As many as 33 U.S. departments expect new space to become available to them by 2005. Of these, 26 (79%) expect new space by the end of 2000. The departments are rather optimistic about timely delivery of the new space. Over 60% expect it to be available on time or expect it is likely to be available on time. Once again, institutional and state sources are the two most commonly listed (Table 9).
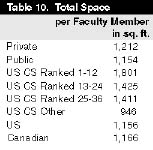
Table 10 presents the ratio of the total departmental space available to the number of FTE faculty. The total departmental space consists of faculty, staff, and graduate student offices, conference and seminar rooms, and research and instructional laboratories operated by the department. There is little difference between the U.S. and Canada, and little difference between U.S. private and public institutions. However, there are significant differences between top-ranked U.S. departments and those ranked 37 and higher. The departments ranked 1 - 12 report almost twice as much space per FTE (1,801 sq. ft.) as those departments ranked 37 and up (946 sq. ft.).
Use of the planned space is similar to the use of the space currently available to the programs. However, there appears to be a greater emphasis on laboratory space, with half of the planned space allocated to research and instructional labs (Figure 2 below).
Too few responses were received from the Canadian departments about recently acquired, renovated, or planned space to report aggregate statistics. Out of 8 Canadian departments responding, two reported a gain of new space and one reported a loss of space. Two Canadian departments reported renovation of some of the existing space during the reporting period. Finally, three Canadian departments expect new space by the end of 2005.
Teaching loads
Data submitted from departments using the quarter system were converted to semesters, using the following conversion: 1 quarter course = 0.67 semester courses. An official teaching load of 3 semester courses per year was reported by 31% of the respondents, and an additional 31% reported an official teaching load of 4 semester courses per year. The minimum reported was 0.67 and the maximum reported was 8.
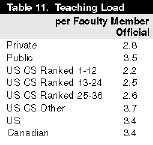
Table 11 on page 7presents the average official teaching loads. Teaching loads are correlated with the rank. In particular, official teaching loads in departments ranked 1 - 36 are about 50% lower than in the departments ranked 37 and higher. Teaching loads reported by programs at private universities are about 20% lower than those reported by departments at public institutions. Actual teaching loads reported are generally lower than official loads. However, due to technical problems with the survey form, the data on actual teaching loads are not reliable and will not be reported.
Ninety-five percent of the departments that responded to the survey allow for teaching load reductions. Of these, 86% allow for reduction as part of startup packages for new faculty members. Other commonly cited reasons for load reductions are: administrative duties, course buyout, and strong research program, cited respectively by 83%, 76%, and 44% of the departments that permit load reductions. The average reported buyout was 19% of annual salary. One-quarter of the departments also listed type and size of class as reasons for load reduction.
Graduate student support
One of the goals of the survey was to determine typical work requirements for teaching and research assistants. We found that for 78% of the U.S. programs, the standard work requirement for a TA is 20 hrs/week, with the mean being close to 20 hrs/week for all classes of programs. In contrast, the Canadian respondents report a mean standard work requirement for a TA of only 12 hrs/week. In the case of research assistants, 80% of the U.S. programs report 20 hrs/week as the standard work requirement. The mean standard work requirement for an RA reported by the Canadian programs was 17.6 hrs/week.
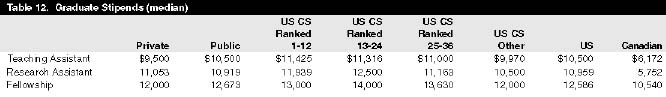
The survey asked for the net value of stipends (stipend for a nine-month assignment minus tuition and fees) for teaching assistants, research assistants, and fellowship holders. Since there was significant variability in the reported stipends, we decided to report the median stipend values, which are less sensitive to inaccuracies in the reported data. The median net stipends are shown in Table 12. The results show that there are no significant differences in net stipends among different categories of programs. However, teaching and research assistantship stipends reported by the Canadian programs are substantially lower (by about 40%) than those reported by the U.S. institutions. The results in Table 12 also show that teaching assistantship stipends are slightly lower than for research assistantships and these, in turn, are lower than for fellowships.
Academic progress was the factor given most frequently (63%) in determining stipend amounts. Others commonly reported included: passed qualifier (50%), differences in the source of funding (48%), recruitment enhancements (26%), and GPA (15%).
In the survey, we also gathered information on the number of supported graduate students. Table 13 presents the ratio of the number of graduate students with support to the number of full-time graduate students for various categories of programs.
The survey provided interesting insights into recruitment incentives used to attract new graduate students. Forty-one percent of U.S. programs and 65% of Canadian programs reported first-year stipend enhancements. Guaranteed multi-year support was reported by 51% of programs, with 44% guaranteeing support for 2 years and 16% of them guaranteeing support for 3 years. Paid visits to campus were reported as an incentive by 44% of programs, with a median amount per visit of $500 and a maximum of $1,000. Finally, guaranteed summer support was reported by 28% of the programs. The median amount of summer support was $3,600 for a U.S. program and $3,332 and for a Canadian program.
Conclusions
The initial feedback from the Snowbird workshop where the results of the survey were presented indicates that such data are of great interest to computer science and computer engineering departments. It was a common sentiment that the survey needs to be conducted regularly every two or three years so as to provide meaningful data for the temporal analysis of changes in resources available to computer science and engineering programs. At the same time, discussions at the workshop and e-mail correspondence received by the authors indicated several shortcomings in the survey design and in the implementation of web-based survey forms. The survey is currently under review by the CRA Board with the goal of making it more precise, streamlining it, and making it easier to complete. It is expected that the survey will be repeated in two years.
Acknowledgments
We would like to thank Larry Finkelstein, Chip Martel, and Moshe Vardi for their help in developing the survey. Greg Andrews’ leadership, help, and encouragement throughout the whole project is greatly appreciated. We would also like to acknowledge the assistance obtained from the CRA staff, especially from Bill Aspray, Jean Smith, and Stacy Cholewinski. Finally, we would like to thank Lena Truszczynska for her help in analyzing the results of the survey.
