THIS IS AN ARCHIVED VERSION OF CRA'S WEBSITE. THIS ARCHIVE IS AVAILABLE TO PROVIDE HISTORICAL CONTENT.
PLEASE VISIT HTTP://WWW.CRA.ORG FOR THE LATEST INFORMATION
| About CRA |
| Membership |
| CRA for Students |
| CRA for Faculty |
| CRA-Women |
| Computing Community Consortium (CCC) |
| Awards |
| Projects |
| Events |
| Jobs |
| Government Affairs |
| Computing Research Policy Blog |
| Publications |
| Data & Resources |
| CRA Bulletin |
| What's New |
| Contact |
| Home |

CRA Taulbee Trends:
Early Employment of Ph.D.s
by Jay Vegso
<< Back to Taulbee Survey homepage
This article concerns the employment of computer science and computer engineering doctorates in the United States and Canada in the first year after they received their degrees.
The Taulbee Survey, which is conducted each Fall, asks for the employment status of those who received Ph.D. degrees during the previous academic year (AY). Due to changes in the survey, including the addition of new employment categories, it is difficult to trace employment trends before AY1984/1985.
Table 1 shows the results from AY1984/1985 onward as percentiles, since these are more useful for tracking trends than raw numbers. These figures exclude the approximately 15 to 20 percent of doctorates whose employment status were unknown each year, as well as those who were listed as unemployed (who average to only 1 percent).
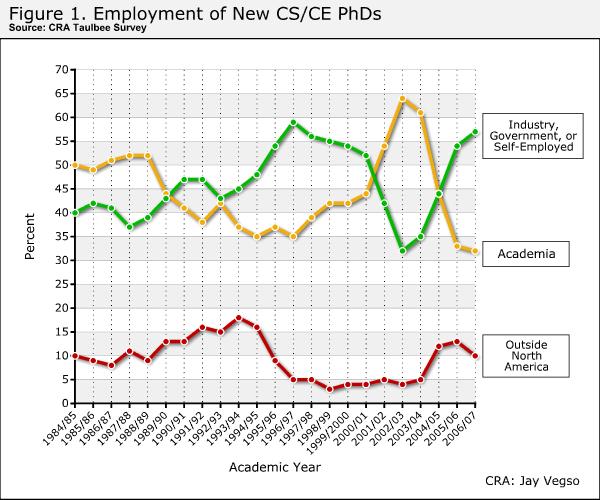
Figure 1 illustrates the proportion of doctorates who were employed outside of academia (i.e., if self-employed, or in industry or government), academia (i.e., in Ph.D. and non-Ph.D.-granting CS/CE departments, as well as in non-CS/CE departments), and outside North America. Between 1985 and 1990, more doctorates worked in academia (50%) than outside it (40%). After this, however, employment in industry dominated, rising to nearly 60% in 1997. Since 2001, however, there have been two dramatic reversals. Between 2001 and 2003, the share of doctorates going into academia jumped from 44% to 64%, with a concomitant drop in the share working in industry from 52% to 32%. As the fortunes of the IT industry recovered, so did doctoral employment in the sector. By 2007, industry claimed 57% of doctorates while academia had slipped to 32%. During all of this, the share of doctorates working outside the US and Canada varied between 10% and 18% from the mid-1980s until the mid-1990s, and then dropped to about 5% until 2004. Since then, the portion of recent doctorate recipients working abroad has been 10% and above.
| Table 1. Employment of New Ph.D. Recipients | |||||||
| Ph.D Received in Academic Year |
Ph.D.-Granting CS/CE
Dept.
|
Non-Ph.D.-Granting
CS/CE Dept.
|
Non-CS/CE Dept.
|
Industry
|
Government
|
Self-Employed
|
Outside U.S./Canada
|
| 1984/1985 |
36%
|
10%
|
4%
|
34%
|
4%
|
2%
|
10%
|
| 1985/1986 |
39%
|
7%
|
3%
|
37%
|
5%
|
1%
|
9%
|
| 1986/1987 |
39%
|
9%
|
4%
|
37%
|
4%
|
1%
|
8%
|
| 1987/1988 |
40%
|
9%
|
3%
|
33%
|
4%
|
0%
|
11%
|
| 1988/1989 |
39%
|
10%
|
4%
|
34%
|
4%
|
1%
|
9%
|
| 1989/1990 |
30%
|
11%
|
3%
|
38%
|
3%
|
2%
|
13%
|
| 1990/1991 |
29%
|
10%
|
2%
|
42%
|
3%
|
2%
|
13%
|
| 1991/1992 |
25%
|
9%
|
3%
|
41%
|
4%
|
2%
|
16%
|
| 1992/1993 |
26%
|
12%
|
4%
|
37%
|
4%
|
2%
|
15%
|
| 1993/1994 |
24%
|
9%
|
3%
|
38%
|
4%
|
2%
|
18%
|
| 1994/1995 |
26%
|
8%
|
1%
|
41%
|
5%
|
2%
|
16%
|
| 1995/1996 |
31%
|
3%
|
2%
|
49%
|
3%
|
2%
|
9%
|
| 1996/1997 |
30%
|
4%
|
2%
|
54%
|
3%
|
2%
|
5%
|
| 1997/1998 |
35%
|
3%
|
1%
|
50%
|
4%
|
2%
|
5%
|
| 1998/1999 |
38%
|
3%
|
0%
|
49%
|
2%
|
3%
|
3%
|
| 1999/2000 |
38%
|
3%
|
1%
|
50%
|
3%
|
1%
|
4%
|
| 2000/2001 |
39%
|
4%
|
0%
|
49%
|
2%
|
1%
|
4%
|
| 2001/2002 | 52% | 1% | 1% | 39% | 3% | 0% | 5% |
| 2002/2003 | 58% | 4% | 1% | 29% | 2% | 1% | 4% |
| 2003/2004 | 56% | 4% | 0% | 30% | 3% | 1% | 5% |
| 2004/2005 | 35% | 7% | 2% | 41% | 3% | 1% | 12% |
| 2005/2006 | 26% | 5% | 1% | 50% | 3% | 1% | 13% |
| 2006/2007 | 26% | 5% | 2% | 54% | 3% | 1% | 10% |
[Last updated June 12, 2008]
Copyright © 2007 Computing Research Association. All Rights Reserved. Questions? E-mail: webmaster@cra.org.