THIS IS AN ARCHIVED VERSION OF CRA'S WEBSITE. THIS ARCHIVE IS AVAILABLE TO PROVIDE HISTORICAL CONTENT.
PLEASE VISIT HTTP://WWW.CRA.ORG FOR THE LATEST INFORMATION
| About CRA |
| Membership |
| CRA for Students |
| CRA for Faculty |
| CRA-Women |
| Computing Community Consortium (CCC) |
| Awards |
| Projects |
| Events |
| Jobs |
| Government Affairs |
| Computing Research Policy Blog |
| Publications |
| Data & Resources |
| CRA Bulletin |
| What's New |
| Contact |
| Home |

<<Back to September 2007 CRN Table of Contents
[Published originally in the September 2007 edition of Computing Research News, Vol. 19/No. 4]
An Update on Trends in Degree Production
by Jay Vegso
With plans under way for CRA's next Taulbee Survey of PhD-granting CS/CE departments in the fall, it is a good time to mention that CRA's website offers trend data from both the Taulbee reports and from the National Science Foundation. The two sources complement each other: Taulbee data are more current and focused on CS/CE (the NSF groups information science with computer science), while NSF data provide longer trends, an opportunity to compare CS/CE with other fields, and include all degree-granting institutions.
The following is a brief summary of some of the information that you can find on the website. It focuses on the relative popularity of CS and trends in degree production by gender, ethnicity and citizenship. Basic employment information about doctorate recipients also is touched on.
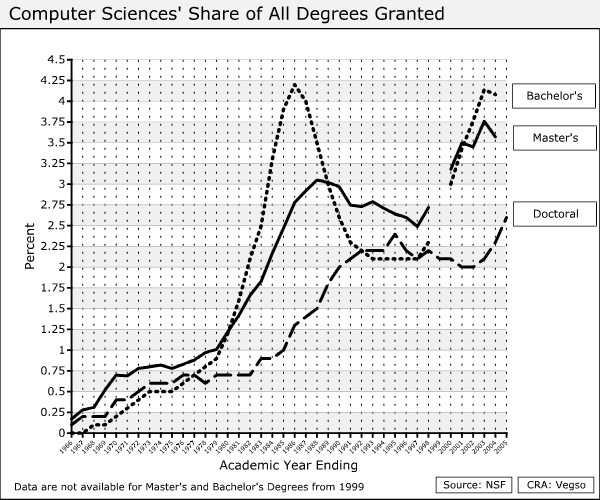
Bachelor's Degrees
The most recent data reported by the NSF are from 2004, when degree production peaked. Between 1998 and 2004, the number of degrees awarded more than doubled to more than 57,000. Likewise, the CS share of all undergraduate degrees granted rose from about 2 percent to 4 percent. Interestingly, this equals the share enjoyed by CS during the production boom of the early 1980s. When NSF data appear for the period 2004 through 2006, they are likely to reflect the Taulbee Survey's findings that production dropped significantly (28% among Taulbee's PhD-granting departments).
Between 1984 and 2004, the share of CS bachelor's degrees awarded to women fell from 37 percent to 25 percent. Taulbee data from 2005 and 2006 suggest that upcoming NSF studies will report that the share of degrees granted to women continued to fall in those years.
Since 1991, the biggest trend in the ethnic background of U.S. citizens who received bachelor’s degrees in CS has been a decrease in the share of degrees granted to non-Hispanic whites. In 2004, whites received 64 percent of CS bachelor's degrees, down from 77 percent in 1991. Small gains were made by other groups, particularly Asian/Pacific Islanders, who saw their representation grow from 9 percent to 17 percent by 2001.
Regarding the citizenship of undergraduate degree recipients, the NSF reported that only 8 percent of degrees in CS were awarded to foreigners. This percentage has not changed significantly since 1991.
Master's Degrees
As with bachelor's degree information, the NSF's most recent data end in 2004. As a result, they do not reflect the decline that the Taulbee Survey has found for the years since then. What they do show is that production nearly doubled between 1997 and 2004 to 19,853. During this buildup, CS reached its highest share of all degrees granted: 3.8 percent in 2003. As was the case at the undergraduate level, however, the popularity of CS dropped slightly in 2004.
Although the number of master's degrees granted to women continued to grow over the years, it did not grow faster than the number granted to men between the early 1980s and the late 1990s. As a result, the share of master's degrees granted to women during that period hovered between 25 percent and 30 percent. It climbed to 33 percent between 2000 and 2002, before declining to 31 percent in 2004.
As seen at the bachelor's degree level, the share of master's degrees granted to whites among U.S. citizens has fallen over the past several years. In 1994, 76 percent of master's degrees in CS were granted to whites; in 2004, the number was 60 percent. Blacks, Hispanics and American Indians/Alaskan Natives all saw their share of degrees double, though they started from a small base and none has broken 10 percent. In 2000, the share of degrees granted to Asians also grew to 27 percent from 17 percent in 1994.
Unlike what is seen at the undergraduate level, a large portion of master's degrees are granted to foreigners. In 2004, temporary visa holders received 44 percent of CS master's degrees. This number has been relatively stable since 2000 (and was only 30 percent in 1991).
Doctoral Degrees
The NSF has released data on doctorates up to 2005. Between 2002 and 2005, CS doctoral degrees granted increased 40 percent, to 1,136. During this period, CS enjoyed the fastest growth rate among all science and engineering (S&E) fields. In addition, it reached its highest share of Ph.Ds awarded among both S&E fields (4%) and all fields (2.6%). Taulbee Survey data from 2006 suggest that the NSF will find that CS doctoral production will surge another 25 percent that year. However, declines in the number of students passing qualifiers, new students and total enrollments all indicate that PhD production should peak in the next few years.
The share of CS doctoral degrees awarded to women has increased slowly over time. Nevertheless, between 2002 and 2005 the figure hovered at a little over 20 percent. It is difficult to see how significant growth in women's share of CS doctorates can be achieved without improvements at the undergraduate and master's levels.
In contrast to the declining share of bachelor's and master's degrees granted to whites, a relatively consistent 70 percent to 75 percent of doctorates were granted to them between 1993 and 2005. The share granted to Asians varied between 15 percent and 20 percent, while blacks, Hispanics and American Indians each received less than 5 percent of degrees.
The biggest trend in the citizenship of doctorate recipients in the past decade has been the growth in the portion granted to non-U.S. citizens on temporary visas. Between 1993 and 2003, about 50 percent to 53 percent of doctorates were foreigners. This figure increased in 2004 and 2005, to slightly over 60 percent. The growth of temporary visa holders among these doctorate recipients has been steady. In 1994, 75 percent of non-U.S. citizens held temporary visas. This had risen to 90 percent in 2005. Taulbee Survey responses for enrollments suggest that these figures are unlikely to change significantly in the next few years.
The Taulbee Survey also collects information on what doctorate recipients were doing the first year after they received their degrees. One way of grouping the results is by categories of academia (with most working in PhD-granting departments), non-academia (most in industry, and single-digit portions in government or self-employed), and work outside the United States and Canada. Between 1985 and 1990, more doctorates worked in academia (50%) than outside it (40%). After this, however, employment in industry dominated, rising to nearly 60 percent in 1997. Since 2001, however, there have been two dramatic reversals. Between 2001 and 2003, the share of doctorates going into academia jumped from 44 percent to 64 percent, with a concomitant drop in the share working in industry from 52 percent to 32 percent. As the fortunes of the IT industry recovered, so did doctoral employment in the sector. By 2006, industry claimed 54 percent of doctorates while academia had slipped to 33 percent. During all of this, the share of doctorates working outside the United States and Canada varied between 10 percent and 18 percent from the mid-1980s until the mid-1990s, and then dropped to about 5 percent until 2004. Since then, the share working abroad has returned to 13 percent.
Additional Information
There are three places on the CRA website to find degree information: the CRA Bulletin (www.cra.org/bulletin), the Taulbee Survey home page (www.cra.org/statistics), and the compilation of NSF data at www.cra.org/info/education/us/.
Copyright © 2007 Computing Research Association. All Rights Reserved. Questions? E-mail: webmaster@cra.org.