THIS IS AN ARCHIVED VERSION OF CRA'S WEBSITE. THIS ARCHIVE IS AVAILABLE TO PROVIDE HISTORICAL CONTENT.
PLEASE VISIT HTTP://WWW.CRA.ORG FOR THE LATEST INFORMATION
| About CRA |
| Membership |
| CRA for Students |
| CRA for Faculty |
| CRA-Women |
| Computing Community Consortium (CCC) |
| Awards |
| Projects |
| Events |
| Jobs |
| Government Affairs |
| Computing Research Policy Blog |
| Publications |
| Data & Resources |
| CRA Bulletin |
| What's New |
| Contact |
| Home |
<< Back to November 2005 CRN Table of Contents
[Published originally in the November 2005 edition of Computing Research News, Vol. 17/No. 5]
[This updated version of the article was posted February 16, 2006. Table 2 and its accompanying text, comparing 2004 to 2002 salaries, was revised.]
Results of CRA 2004 Salary Survey of Computing Research Staff in Industrial Labs
By Dick Waters
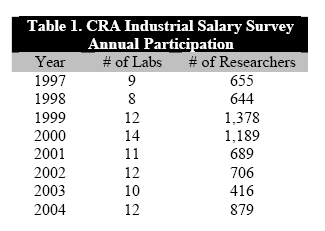
In December 2004 and January 2005, CRA conducted its eighth annual salary survey of computing research staff in industrial laboratories. Twelve organizations representing 879 researchers responded. Of these 879 researchers, 76% held PhDs, 17% masterís degrees, 7% bachelorís degrees, and 3 had no degree. As can be seen in Table 1, the level of participation in the survey was anomalously low in 2003. It returned to typical levels in 2004.

Organizations were asked to provide data about base salary and total cash compensation (which includes items such as bonuses). Respondents were asked to report means and medians for each category. Companies that completed the survey received detailed results in April 2005. A summary of the results is presented in Table 2.

Observations
The most important thing to notice about Table 1 is that the number of labs participating is not very large. (The number of industrial members of the CRA is not very large.) Therefore, the decision of a single lab to participate or not has significant impact on the overall statistics. The CRAís Taulbee survey of university salaries is much more stable because there are more than 10 times as many institutions involved and changing a few participants has relatively little impact on aggregated data.
The volatility of the industrial salary survey means that considerable caution must be exercised when comparing results form one year to the next. In particular, the participation in the 2003 survey was so different from other recent surveys that it is not a useful basis for comparison. In addition to having 2 fewer labs than in 2002 or 2004, it had several key participants in 2002 and 2004 replaced by new, smaller labs. In contrast, the participants in the 2002 and 2004 surveys are much more similar. For that reason, Table 2 compares the 2004 data with 2002 data instead of 2003 data.
Table 2 shows total cash compensation to have changed relatively little over the two-year period. Compensation increased a moderate amount for new PhDs; however, it dropped for those with middle experience and rose only fractionally for those with more than 10 years of experience.
The main finding of the 2002 survey was a gain of about 5% over 2001 in compensation for experienced researchers, but a drop of almost 4% in compensation for new Ph.D.s. Putting those numbers together with the numbers in Table 2 shows that industrial lab compensation has been remarkably constant now for three years in a row.
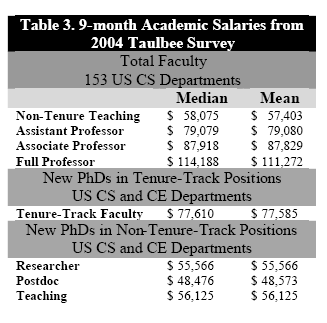
In addition to comparing the 2004 industry data with historic industry data, it is interesting to compare it with current university salaries. The latest Taulbee university salary data is summarized in Table 3. (See the May 2005 issue of Computing Research News for full data).

Table 3 and Table 2 cannot be directly compared because Table 3 has 9-month salaries while Table 2 has 12-month salaries and because the definitions of the experience levels in the two tables are not the same. Nevertheless, multiplying the faculty salaries in Table 3 by 12/9ths to take account of the additional 3 months of salary professors can typically get from other sources, and approximately lining up the experience levels suggests that tenure track faculty are paid approximately 5-15% less than industrial salaries with by far the greatest differences at mid career. No matter what adjustments you make, non-tenure track positions in universities are paid spectacularly less than industrial salaries, with the typical post doc probably ending up with not much more than half the salary of a new industry PhD.
In October 2005, CRA will be contacting industrial labs about the 2005 survey. Companies that complete the survey should receive the results in January.
Dr. Waters is President and CEO of Mitsubishi Electric Research Labs, and is a member of the CRA Board.
Copyright © 2007 Computing Research Association. All Rights Reserved. Questions? E-mail: webmaster@cra.org.
