THIS IS AN ARCHIVED VERSION OF CRA'S WEBSITE. THIS ARCHIVE IS AVAILABLE TO PROVIDE HISTORICAL CONTENT.
PLEASE VISIT HTTP://WWW.CRA.ORG FOR THE LATEST INFORMATION
| About CRA |
| Membership |
| CRA for Students |
| CRA for Faculty |
| CRA-Women |
| Computing Community Consortium (CCC) |
| Awards |
| Projects |
| Events |
| Jobs |
| Government Affairs |
| Computing Research Policy Blog |
| Publications |
| Data & Resources |
| CRA Bulletin |
| What's New |
| Contact |
| Home |
Back to November 2002 CRN Table of Contents
[Published originally in the November 2002 edition of Computing Research News, Vol. 14/No. 5, p. 3.]
Results of CRA Industrial Salary Survey of CS Research LabsBy David Waltz
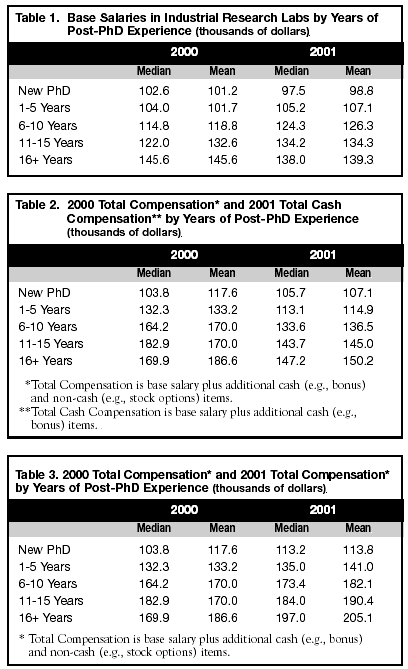
In November 2001, CRA conducted its fifth Industrial Salary Survey of CS Research Laboratories. Eleven organizations representing 689 researchers responded. (In 2000, fourteen organizations with 1,189 researchers participated.) Of these 689 researchers, 72 percent held Ph.Ds, 24 percent M.S. degrees, 4 percent B.S. degrees, and <0.1 percent other. Organizations were asked to provide data about base salary, total cash compensation (which includes items such as bonuses) and total non-cash compensation (e.g., the value of stock options). Respondents were asked to report means and medians for each category. Companies that completed the survey received detailed results in January 2002. A summary of the results is presented in Tables 1, 2 and 3.
Table 1 (a comparison of base compensation) is non-problematic, but Tables 2 and 3 need explanation. In both 2000 and 2001, significant amounts of reported income came from non-cash compensation, primarily stock options. We calculated the value of this non-cash compensation assuming stock prices would appreciate at 15 percent per year. The large resulting 2001 non-cash compensation values raised apparent total compensation significantly, even though options were granted to fewer than 10 percent of the researchers (from 3 of 11 reporting organizations). However, it is highly likely that all options granted in 2001 are worthless today (i.e., far below the option exercise price), making Table 3 very misleading. Consequently the interpretive conclusions below are drawn from Table 2, our best estimate of actual realized income. (Caveat: Clearly the comparison in Table 2 isn't perfect--it is likely that some options granted in 2000 also proved worthless, so the total compensation for 2000 is probably overstated somewhat.)

Observations
The main finding of the 2000 survey was that compensation--both base and total--had soared across the board. In 2001, there were some gains in base salaries, but total compensation dropped significantly except for new Ph.Ds.
More specifically, I would like to highlight four year-on-year changes in 2001:
- total compensation dropped significantly--14% to 21%--for researchers with 1 or more years of experience.
- mean and median base compensation rose for researchers with 1 to 15 years of experience, with the largest increases--6% to 8%--for those with 6 to 10 years experience.
The net effect of these first two trends is a large shift away from variable compensation. Variable compensation, which accounted for about one-third of total compensation in 2000, shrank to less than 10 percent in 2001.
- starting base salaries decreased slightly (-5% for the median, -2.4% for the mean), although starting total compensation did not show a clear trend (+1.8% for the median, -8.9% for the mean); and
- base compensation dropped for researchers with 16+ years of experience (-5.2% for the mean, -4.3% for the median).
Comparing these data with the most recent Taulbee Survey salary data (see March 2002 issue of Computing Research News), it is clear that base (9-month) average faculty compensation is substantially lower than industrial compensation at all levels. However, if we assume that faculty actually receive 12 months of compensation at the 9-month rate (i.e., 4/3 of 9-month compensation) through a combination of summer salary, consulting, book royalties, and other sources, then full-professor compensation becomes roughly comparable to industrial compensation for those with 11+ years of experience. However, compensation for assistant and associate professors still lags that of comparably experienced industrial researchers by around 25 percent.
In September 2002, CRA mailed questionnaires for the 2002 survey of industry lab salaries. Companies that complete the survey should receive the results in December.
I would especially like to thank Drew Sutter of CRA for his excellent efforts in analyzing and organizing this data, and Patrick McMullen for collecting the data.
Dr. Waltz is President of the NEC Research Institute, and was elected to the
CRA Board this year. He is Co-Chair of CRA's Industry Committee.
Copyright © 2007 Computing Research Association. All Rights Reserved. Questions? E-mail: webmaster@cra.org.
