THIS IS AN ARCHIVED VERSION OF CRA'S WEBSITE. THIS ARCHIVE IS AVAILABLE TO PROVIDE HISTORICAL CONTENT.
PLEASE VISIT HTTP://WWW.CRA.ORG FOR THE LATEST INFORMATION
| About CRA |
| Membership |
| CRA for Students |
| CRA for Faculty |
| CRA-Women |
| Computing Community Consortium (CCC) |
| Awards |
| Projects |
| Events |
| Jobs |
| Government Affairs |
| Computing Research Policy Blog |
| Publications |
| Data & Resources |
| CRA Bulletin |
| What's New |
| Contact |
| Home |

<< Back to May 2009 CRN Table of Contents
<< Back to Taulbee Survey home page
[Published originally in the May 2009 edition of Computing Research News, Vol. 21/No. 3]
2007-2008 Taulbee Survey
Upward Trend in Undergraduate CS Enrollment; Doctoral Production Continues at Peak Levels
By Stuart Zweben
The CRA Taulbee Survey1 is conducted annually by the Computing Research Association to document trends in student enrollment, degree production, employment of graduates, and faculty salaries in Ph.D.-granting departments of computer science (CS), computer engineering (CE) and information (I)2 in the United States and Canada. This article and the accompanying figures and tables present the results of the 38th annual CRA Taulbee Survey.
Information is gathered during the fall. Responses received by January 5, 2009 are included in the analysis. The period covered by the data varies from table to table. Degree production and enrollment (Ph.D., Master's, and Bachelor's) refer to the previous academic year (2007-2008). Data for new students in all categories refer to the current academic year (2008-2009). Projected student production and information on faculty salaries and demographics also refer to the current academic year. Faculty salaries are those effective January 1, 2009.
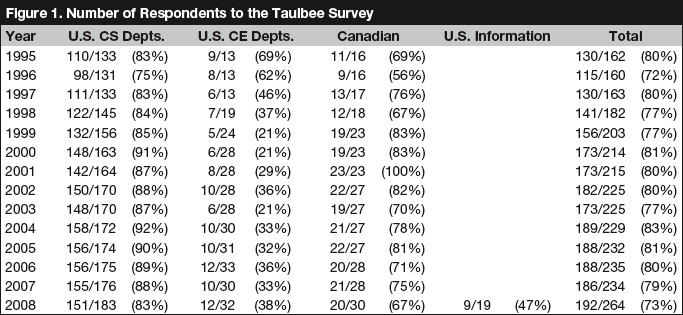
We surveyed a total of 264 Ph.D.-granting departments. Included in this count are 19 I-school departments, which were surveyed for the first time. Of the 264 departments surveyed, 192 departments returned their survey forms, for a response rate of 73%. This is down from last year’s 79%, but is still quite comprehensive (see Figure 1) and is negatively influenced by the 47% response rate from the new I departments and the typical low response rate (38%) from CE programs. We had a good response rate from U.S. CS departments (151 of 183, or 83%), and a reasonable response rate (20 of 30, or 67%) from Canadian departments, although the response rate in both U.S. CS and Canadian departments was lower this year than last year.3
The survey form itself is modified slightly each year to ensure a high rate of return (e.g., by simplifying and clarifying), while continuing to capture the data necessary to understand trends in the discipline and also reflect changing concerns of the computing research community. In addition to including I departments, this year’s survey modified the specialty areas within the Ph.D. (see Table 4 and the accompanying discussion). The ethnicity categories also were modified to conform to those used by the National Center for Educational Statistics.
Departments that responded to the survey were sent preliminary results about faculty salaries in December 2008; these results included additional distributional information not contained in this report. The CRA Board views this as a benefit of participating in the survey.
We thank all respondents who completed this year's questionnaire. Departments that participated are listed at the end of this article.
Ph.D. Degree Production, Enrollments and Employment (Tables 1-8)
Total Ph.D. production among the responding departments grew to 1,877 for the period between July 2007 and June 2008 (Table 1). This represents a 5.7% increase over last year. However, it includes 77 who graduated with I degrees (see Tables 2 and 3). Nearly all I degree graduates would not have been counted in previous years (though a small number may have been reported among CS department graduates). Subtracting the I degree graduates yields a total of 1,800 for a 1.4% increase over last year. This year’s production of more than 1,800 is well below the nearly 2,000 predicted last year. The “optimism ratio,” defined as the actual number divided by the predicted number, was 0.90, as opposed to last year’s 0.95. If this year’s optimism ratio holds again next year, there will be approximately 1,900 new Ph.D.s produced in 2008-09. However, it also may be that we are nearing a peak production rate. Changing hiring conditions resulting from the weak economy also may delay graduation for some Ph.D. students.
The number of new students passing thesis candidacy exams (most, but not all, departments have such exams) rose 7%, although more departments reported such exams this year. When the I departments are subtracted, the increase is only 4%. On a per department basis, the numbers are down slightly, whether I departments are included or not. The number of students passing the qualifier also rose significantly (13%) to its level of two years ago if I departments are included. Without I departments, the increase still was a healthy 9%.
The total number of new CS Ph.D. students (Table 5) rose by 10%, following a 4% increase last year. This year, the increase was due to the admission of a larger class of new students, while last year it was due to Master’s students becoming Ph.D. students. More departments reported new student data this year, so the 10% increase is somewhat misleading. The number of new CS Ph.D. students per department reporting actually is almost the same this year as last. Figure 3 shows a graphical view of the pipeline for computer science programs. The data in this graph are normalized by the number of departments reporting. The graph offsets the qualifier data by one year from the data for new students, and offsets the graduation data by five years from the data for new students. These data have been useful in estimating the timing of changes in production rates. They suggest that we have peaked in CS Ph.D. production for a few years, and expect a slight decline during the next couple of years. However, the turnaround in the number of students who passed qualifiers makes it difficult to forecast longer-term trends.
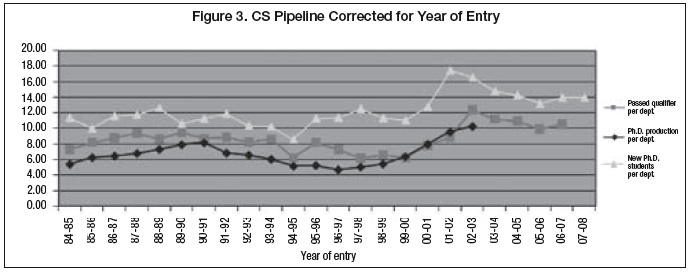
Table 5a reports the data for new students in fall 2008 from outside North America. Top 12 U.S. departments continue to have a somewhat higher fraction of domestic students than do lower-ranked departments, and Canadian departments continue to have a lower percentage of Ph.D. students from outside North America than do their U.S. counterparts. The range of new Ph.D. students in U.S. programs who are not North American is 50% to 64% across the ranking strata. I departments are at the lower end of this range. Among U.S. programs ranked 25-36, the fraction of new Ph.D. students from outside North America increased from 59% to 64%. In Canadian programs, the fraction of new students who were not North American declined from 43% to 36%. Overall, the fraction of non-North American new Ph.D. students (54.0%) is comparable to last year’s 54.8%.
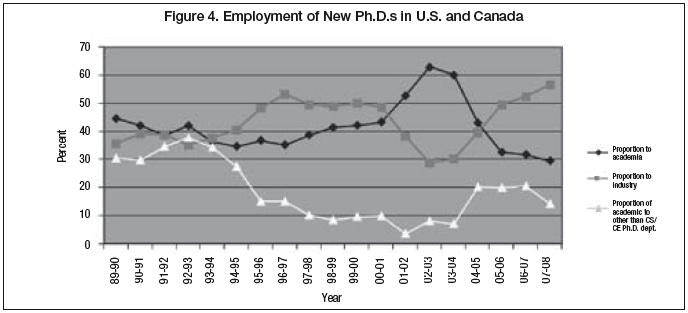
Figure 4 shows the employment trend of new Ph.D.s in academia and industry, and the proportion of those going to academia who took positions in departments other than Ph.D.-granting CS/CE departments. Table 4 shows a more detailed breakdown of the employment data for new Ph.D.s. The trend toward employment in industry over academia continues for the 2007-08 Ph.D. graduates. Of those for whom employment type is known, industry hired 56.6% of new Ph.D. graduates, compared to 52.3%, 49.4% and 39.6% in the previous three years. In contrast, about 30% took academic employment in North America (compared to 32%, 33%, 43% and 60%, respectively, in the previous four years). There also is a continued decline in the percentage who went into tenure-track positions in Ph.D.-granting programs (9.4% vs 11.4%, 12.8%, 17.5% and 27.5% in the previous four years) and to non-Ph.D.-granting CS/CE departments (4.2% vs. 4.7%, 5.2% and 7.0% in the previous three years). The decline in the number of persons going into tenure-track positions in Ph.D.-granting programs is almost exactly offset by an increase in the number of new Ph.D.s going to postdoctoral positions.
The unemployment rate for new Ph.D.s remains less than 1%. The proportion of Ph.D. graduates who were reported taking positions outside of North America, among those whose employment is known, decreased again this year to 9.2%, from 10% last year and 13.1% two years ago.
Table 4 also indicates the areas of specialty of new CS/CE Ph.D.s. Year-to-year fluctuations among these data are common and multi-year trends are difficult to discern. This year, there was an increase in the database/information systems area, which no doubt is influenced by the inclusion of I departments in this year’s survey. On the other hand, the programming languages and OS/networks area showed declines. AI/robotics took over from OS/networks as the area with the largest number of graduates. In this year’s survey, we refined the choice of areas that the departments could use to classify Ph.D. recipients, including categories of interest to I departments. We will review the data in comparison with those of previous years to see if this classification is proving useful. There still are a large number of graduates classified as having their degree in some area not specified.
The proportion of women among new Ph.D.s rose for the third straight year, to 20.5% in 2008 from 19.1% last year. This includes I departments, which graduated women Ph.D.s. in higher proportion that did CS and CE departments. However, subtracting the I departments still results in an increase to 20.2% among CS and CE departments (Table 2). Ethnicity characteristics of new Ph.D.s are similar to those reported last year (Table 3). This year, the ethnicity categories were modified to conform to those used by the National Center for Educational Statistics. Thus, the percentages may not all be entirely comparable. This year, we also broke out the reported data when residency status was known but ethnicity was not. Last year, we combined data for ethnicity unknown and residency unknown. Coupled with the inclusion of I departments this year, extra care therefore must be taken when comparing percentages in this year’s ethnicity tables with those from last year. Nevertheless, among CS and CE departments, it appears there was an increase in the proportion of new Ph.D.s awarded to Whites this year, offset by a decrease in those to Asians (including Native Hawaiians and Pacific Islanders).
Current Ph.D. enrollment proportions show a slight decline in women among CS and CE departments (from 19.5% to 18.9%), although when I departments are included the proportion this year is 20.0% (Table 7). With respect to ethnicity breakdowns, there appears to be a larger proportion of Nonresident Aliens this year, offset by a decrease in the proportion of Whites and Asians, including Native Hawaiians and Pacific Islanders (Table 8).
Master's and Bachelor's Degree Production and Enrollments (Tables 9-16)
Master's degree production in CS and CE was negligibly different from last year, although there was a slight decline in CS and an increase in CE. The large number of Master’s degrees in I departments and I degrees from CS departments added considerably to the total count of degrees awarded from the departments responding to this year’s survey. This year, the Master’s degree production numbers are displayed by department type and rank (Table 11b). Curiously, the prediction of the number of CS Master’s degrees to be awarded in 2008-09 is higher than it was last year, while the enrollment in CS Master’s programs is slightly lower. However, last year the departments did a poor job predicting the number of CS Master’s degree recipients (5,883 predicted last year, and 7,383 awarded); therefore the increased prediction of 6,394 this year (Table 12b) appears to be justified.
The fraction of CS Master’s degrees awarded to women was down slightly compared to last year’s survey. In 2007-08, 21.2% of the degrees went to women, while in the previous year 22.7% went to women. The CE numbers were within one-half of one percent of the previous year’s data. Note that I departments awarded 49% of their Master’s degrees to women (Table 9b). The ethnicity of I department Master’s graduates also is more diverse than in CS or CE departments (Table 10b). In CS and CE departments, there is a slight increase in the fraction of graduates who are Nonresident Aliens, and a corresponding decrease in those who are Asian or Native Hawaiians/Pacific Islander.
Bachelor's degree production (Tables 9 and 10) again was down significantly, by nearly 20% this year. This year’s decline is in line with the 16% decline estimated by the departments last year, and follows the declining trends in the number of new Bachelor’s students that have been reported widely in recent years.
Bachelor's degree production (Tables 9a and 10a) in CS was down 10% this year, compared to a decline of nearly 20% last year. The slowing of the decline in degree production is consistent with an increase in overall enrollment in U.S. CS programs. The average number of new students per department in U.S. CS programs is up 1.7% over last year, and if only majors are considered, the increase is 9.5% (however, the latter number is influenced by departments that no longer use pre-majors, and hence all of their new students now are counted as majors). During the last three years, the cumulative increase in average number of new students per department is 9.4%, and is 15.8% if only majors are considered. Furthermore, some of the CS departments that now are able to report I majors reported these majors among their CS majors in previous years. So the number of CS majors this year actually grew even more than is represented in the tabulated data. It definitely appears that U.S. CS departments are replenishing the freshman and sophomore ranks with larger groups than they are graduating as seniors. Total enrollment per department by majors and pre-majors in U.S. CS programs is up 6.2% over last year, and if only majors are considered, the increase is 8.1%. This is the first increase in total enrollment in CS programs in six years. We should see this reflected in Bachelor’s degree production soon.
New CS student data are similar in Canadian schools, though total Canadian CS enrollment is lower for both majors and pre-majors this year. As mentioned at the beginning of this report, the Canadian data are much more sensitive to the particular departments that responded to the survey, although this also may suggest that Canadian departments are a year or so behind U.S. CS departments in realizing the turnaround.
Diversity in our undergraduate programs remains poor. The fraction of Bachelor’s degrees awarded to women held steady at a paltry 11.8% this year (Table 9a). As was the case last year, nearly two-thirds of those receiving Bachelor’s degrees were White, non-Hispanics.
Faculty Demographics (Tables 17-23)
Total faculty sizes, as well as tenure-track faculty sizes, increased nearly 5% at U.S. CS departments during the past year. There was a 12% increase in the number of postdocs at U.S. CS departments this year compared to last year, although the number of researchers at these departments declined by nearly 14%; when combined, the total number is down 4%. With the increased opportunities for tenure-track positions, some of the people in the postdoc and researcher categories may have moved to tenure-track. Teaching faculty increased by almost 8% at U.S. CS departments.
The fraction of women hired into tenure-track positions was 21.9%, down from last year’s 23.9% but still slightly above the fraction of new Ph.D.s who were women (20.5%). There was an increased percentage of new faculty members who are Nonresident Aliens and African Americans this year, offset by a decreased percentage of Asians, Native Hawaiians or Pacific Islanders. Although the African American percentage of new tenure-track hires this year rose to 3.4%, this still is a very low fraction, and since the total enrollment in Ph.D. programs currently is less than 2%, this one-year gain is a small contribution to our goal of improving faculty diversity.
Actual faculty size increases were fairly close to predicted values this year. For next year, reporting departments forecast a 3% to 4% growth in tenure-track faculty. These forecasts were made before many institutions announced actions associated with impending economy-related cuts for FY09 and/or FY10. We’ll see if these hiring predictions are met.
Table 18b shows the recruiting results from last year’s hiring cycle. During that cycle, roughly one of every four open tenure-track positions went unfilled. For each of the two previous years, one of every three positions went unfilled. This could be one consequence of the tightening job market. U.S. CS departments ranked 13-24 and Canadian departments filled only about half of their vacant positions.
There was a slight increase in the number of reported retirements this year, and in the number of faculty who went to other than an academic position. However, in general, the distribution of faculty losses was similar to last year (Table 23).
Research Expenditures and Graduate Student Support (Tables 24-26)
Table 24-1 shows the department's total expenditure (including indirect costs or "overhead" as stated on project budgets) from external sources of support. Table 24-2 shows the per capita expenditure, where capitation is computed two ways. The first is relative to the number of tenured and tenure-track faculty members. The second is relative to researchers and postdocs as well as tenured and tenure-track faculty. Canadian levels are shown in Canadian dollars. The data indicate that the higher the ranking, the more external funding is received by the department (both in total and per capita).
Mean total expenditures increased this year in all CS ranking strata except U.S. departments ranked 25-36. Median total expenditures increased in all U.S. CS ranking strata. Canadian departments also showed strong increases in both mean and median expenditures. U.S. departments also generally improved with respect to median per-capita expenditures, as did Canadian departments, although median expenditures using the second capitation method declined in U.S. departments ranked 13-24.
Table 25 shows the number of graduate students supported as full-time students as of fall 2007, further categorized as teaching assistants (TAs), research assistants (RAs), fellows, or computer systems supporters, and split between those on institutional vs. external funds. The number of TAs in CS departments increased significantly this year, except in U.S. departments ranked 13-24. There also was an increase in the total number of RAs this year, except at U.S. departments ranked 1-12. However, the number of RAs supported on external funds declined at U.S. departments ranked 1-12 and 25-26, while the number increased at U.S. departments ranked 13-24 and departments not ranked in the top 36. Lower-ranked departments had more RAs on institutional funds this year compared to last year, while higher-ranked departments had fewer.
The number of externally supported, full-support fellows increased at U.S. departments ranked 1-12 and 25-36, and at Canadian departments (it had declined last year in these strata). This statistic held steady at U.S. departments not ranked in the top 36 and declined at U.S. departments ranked 13-24.
Respondents were asked to "provide the net amount (as of fall 2008) of an academic-year stipend for a first-year doctoral student (not including tuition or fees)." The results are shown in Table 26. Canadian stipends are shown in Canadian dollars. The data show another year of healthy stipend increases for TAs at U.S. departments ranked 1-36 and at Canadian departments, with flat stipend levels at U.S. departments not ranked in the top 36. RA stipends were higher across the board. Fellow stipends at U.S. CS departments showed very modest increases compared to last year.
Faculty Salaries (Tables 27-34)
Each department was asked to report individual (but anonymous) faculty salaries if possible; otherwise, the department was requested to provide the minimum, median, mean, and maximum salaries for each rank (full, associate, and assistant professors and non-tenure-track teaching faculty) and the number of persons at each rank. The salaries are those in effect on January 1, 2009. For U.S. departments, nine-month salaries are reported in U.S. dollars. For Canadian departments, twelve-month salaries are reported in Canadian dollars. Respondents were asked to include salary supplements such as salary monies from endowed positions.
The tables contain data about ranges and measures of central tendency only. Those departments reporting individual salaries were provided more comprehensive distributional information in December 2008. Again this year, 85% of those reporting salary data provided salaries at the individual level.
Last year, we began providing salary data based on time in rank. This year, we reduced the number of time-in-rank strata somewhat as our experience last year indicated that more strata did not provide additional meaningful information.
The minimum and maximum of the reported salary minima (and maxima) are self-explanatory. The range of salaries in a given rank among departments that reported data for that rank is the interval ["minimum of the minima," "maximum of the maxima"].
The mean of the reported salary minima (maxima) in a given rank is computed by summing the departmental reported minimum (maximum) and dividing by the number of departments reporting data at that rank. The “average of dept. median salaries” at each rank is computed by summing the individual medians reported at each rank and dividing by the number of departments reporting at that rank. Thus, it is not a true median of all the salaries. Similarly, "average of dept. mean salaries” at each rank is computed by summing the individual means reported at each rank and dividing by the number of departments reporting at that rank. Thus, it is not a true average of all the salaries.
Overall U.S. CS average salaries (Table 27) increased between 1.6% and 4.5%, depending on tenure-track rank, and 1.4% for non-tenure-track teaching faculty. Faculty at higher rank received larger average increases than did faculty at lower rank. The increases are lower than those experienced in the past few years for all faculty ranks except full professor.
Canadian salaries (Table 33) rose 2.3% to 4.1% among tenure-track ranks, with the largest increase at the associate professor rank and the smaller at the assistant professor rank. Non-tenure-track teaching faculty salaries for Canadian departments rose 4.4%. Except at the full professor rank, Canadian increases were larger than those observed for U.S. CS programs at the same faculty rank.
Average salaries for new Ph.D.s (those who received their Ph.D. last year and then joined departments as tenure-track faculty) increased 1.2% from those reported in last year’s survey (Table 34). This is a smaller increase than was observed in each of the past two years for new Ph.D.s. and, as has been the case for the past few years, is somewhat smaller than the average increases for continuing faculty. There were too few new Ph.D. salaries in Canadian departments to make meaningful comparisons.
Concluding Observations
It is encouraging to see a three-year increase in new undergraduate CS students and the increased total undergraduate enrollment. With the continued peak production of new CS Ph.D.s, the rise in the number of academic faculty positions available among the CRA departments also was welcome. However, economic conditions have changed considerably since last year. How this will affect new Ph.D. hiring in both industry and academia remains to be seen. With the exception of diversity, our discipline entered these changed economic conditions from a position of strength. This should help us cope with the times much better than most.
Rankings
For tables that group computer science departments by rank, the rankings are based on information collected in the 1995 assessment of research and doctorate programs in the United States conducted by the National Research Council (NRC) [see /statistics/nrcstudy2/home.html]. New NRC rankings are anticipated later in 2009, and future Taulbee reports may be modified as a result.
The top twelve schools in this ranking are: Stanford, Massachusetts Institute of Technology, University of California (Berkeley), Carnegie Mellon, Cornell, Princeton, University of Texas (Austin), University of Illinois (Urbana-Champaign), University of Washington, University of Wisconsin (Madison), Harvard, and California Institute of Technology. All schools in this ranking participated in the survey this year.
CS departments ranked 13-24 are: Brown, Yale, University of California (Los Angeles), University of Maryland (College Park), New York University, University of Massachusetts (Amherst), Rice, University of Southern California, University of Michigan, University of California (San Diego), Columbia, and University of Pennsylvania.4 All schools in this ranking participated in the survey this year.
CS departments ranked 25-36 are: University of Chicago, Purdue, Rutgers, Duke, University of North Carolina (Chapel Hill), University of Rochester, State University of New York (Stony Brook), Georgia Institute of Technology, University of Arizona, University of California (Irvine), University of Virginia, and Indiana. All schools in this ranking participated in the survey this year.
CS departments that are ranked above 36 or that are unranked that responded to the survey include: Arizona State University, Auburn, Binghamton University SUNY, Boston University, Case Western Reserve, City University of New York Graduate Center, College of William and Mary, Colorado School of Mines, Colorado State, Dartmouth, DePaul, Drexel, Florida Institute of Technology, Florida International, Florida State, George Mason, Georgia State, Illinois Institute of Technology, Iowa State, Johns Hopkins, Kansas State, Kent State, Lehigh, Louisiana State, Michigan State, Michigan Technological, Mississippi State, Montana State, Naval Postgraduate School, New Jersey Institute of Technology, New Mexico State, New Mexico Technology, North Carolina State, North Dakota State, Northeastern, Northwestern, Oakland, Ohio State, Oklahoma State, Old Dominion, Oregon State, Pace, Pennsylvania State, Polytechnic, Portland State, Rensselaer Polytechnic, Rochester Institute of Technology, Stevens Institute of Technology, Syracuse, Texas A&M, Texas Tech, Toyota Technological Institute (Chicago), Tufts, Vanderbilt, Virginia Tech, Washington State, Washington (St. Louis), Wayne State, Worcester Polytechnic, and Wright State.
University of: Alabama (Birmingham, Huntsville, and Tuscaloosa), Albany SUNY, Arkansas (Fayetteville and Little Rock), Buffalo, California (at Davis, Riverside, Santa Barbara, and Santa Cruz), Central Florida, Cincinnati, Colorado (Boulder), Connecticut, Delaware, Florida, Georgia, Houston, Idaho, Illinois (Chicago), Iowa, Kansas, Kentucky, Louisiana (Lafayette), Louisville, Maine, Maryland (Baltimore Co.), Massachusetts (at Boston and Lowell), Minnesota, Mississippi, Missouri (at Columbia and Kansas City), Nebraska (Lincoln and Omaha), Nevada (Las Vegas and Reno), New Hampshire, New Mexico, North Carolina (Charlotte), North Texas, Notre Dame, Oklahoma, Oregon, Pittsburgh, South Carolina, South Florida, Tennessee (Knoxville), Texas (at Dallas, El Paso, and San Antonio), Tulsa, Utah, and Wyoming.
Computer Engineering departments participating in the survey this year include: Boston University, Clemson, Florida Institute of Technology, Iowa State, Northeastern, Princeton, Purdue, Rensselaer Polytechnic, Santa Clara, Virginia Tech; and the Universities of: California (Santa Cruz), Houston, New Mexico, Southern Californa.
Canadian departments participating in the survey include: Concordia, Dalhousie, McGill, Memorial, Queen's, Simon Fraser, and York, and the Universities of: Alberta, British Columbia, Calgary, Manitoba, Montreal, New Brunswick, Ottawa, Regina, Saskatchewan, Toronto, Victoria, Waterloo, and Western Ontario.
Information departments participating in the survey include: Drexel University, Syracuse, and the Universities of: California (Berkeley), Illinois, Maryland (Baltimore County), Michigan, Pittsburgh, and Washington. I-programs at Indiana University and University of California (Irvine) also submitted information combined with their CS programs.Acknowledgments
Betsy Bizot once again provided valuable assistance with the data collection, tabulation, and analysis for this survey. Thanks also to Debra Richardson and Bobby Schnabel for their assistance in modifying the survey for use with the I-schools, and to Susanne Hambrusch and Jean Smith for offering constructive comments to an earlier version of the report.
Stuart H. Zweben is Professor of Computer Science and Engineering at The Ohio State University.
Endnotes
- The title of the survey honors the late Orrin E. Taulbee of the University of Pittsburgh, who conducted these surveys for the Computer Science Board until 1984, with retrospective annual data going back to 1970.
- Information (I) programs included here are Information Science, Information Systems, Information Technology, Informatics, and related disciplines with a strong computing component. In fall 2008, the first year these programs were surveyed as part of Taulbee, surveys were sent to CRA members, the CRA IT Deans group members, and participants in the iSchools Caucus (www.ischools.org ) who met the criteria of granting Ph.D.s and being located in North America. Other I-programs that meet these criteria and would like to participate in the survey in future years are invited to contact survey@cra.org for inclusion.
- The set of departments responding varies slightly from year to year, even when the total numbers are about the same; thus, we must approach any trend analysis with caution. We must be especially cautious in using the data about CE and I departments because of the low response rates.
- Although the University of Pennsylvania and the University of Chicago were tied in the National Research Council rankings, CRA made the arbitrary decision to place Pennsylvania in the second tier of schools.
- All tables with rankings: Statistics sometimes are given according to departmental rank. Schools are ranked only if they offer a CS degree and according to the quality of their CS program as determined by reputation. Those that only offer CE or I degrees are not ranked, and statistics are given on a separate line, apart from the rankings.
- All ethnicity tables: Ethnic breakdowns are drawn from guidelines set forth by the U.S. Department of Education.
- All faculty tables: The survey makes no distinction between faculty specializing in CS vs. CE programs. Every effort is made to minimize the inclusion of faculty in electrical engineering who are not computer engineers.