THIS IS AN ARCHIVED VERSION OF CRA'S WEBSITE. THIS ARCHIVE IS AVAILABLE TO PROVIDE HISTORICAL CONTENT.
PLEASE VISIT HTTP://WWW.CRA.ORG FOR THE LATEST INFORMATION
| About CRA |
| Membership |
| CRA for Students |
| CRA for Faculty |
| CRA-Women |
| Computing Community Consortium (CCC) |
| Awards |
| Projects |
| Events |
| Jobs |
| Government Affairs |
| Computing Research Policy Blog |
| Publications |
| Data & Resources |
| CRA Bulletin |
| What's New |
| Contact |
| Home |

<< Back to May 2008 CRN Table of Contents
<< Back to Taulbee Survey home page
[Published originally in the May 2008 edition of Computing Research News, Vol. 20/No. 3]
2006-2007 Taulbee Survey
Ph.D. Production Exceeds 1,700; Undergraduate Enrollment Trends Still Unclear
By Stuart Zweben
This article and the accompanying figures and tables present the results of the 37th annual CRA Taulbee Survey1 of Ph.D.-granting departments of computer science (CS) and computer engineering (CE) in the United States and Canada. This survey is conducted annually by the Computing Research Association to document trends in student enrollment, employment of graduates, and faculty salaries.
Information is gathered during the fall. Responses received by February 8, 2008 are included in the analysis. The period covered by the data varies from table to table. Degree production and enrollment (Ph.D., Master's, and Bachelor's) refer to the previous academic year (2006-2007). Data for new students in all categories refer to the current academic year (2007-2008). Projected student production and information on faculty salaries and demographics also refer to the current academic year. Faculty salaries are those effective January 1, 2008.
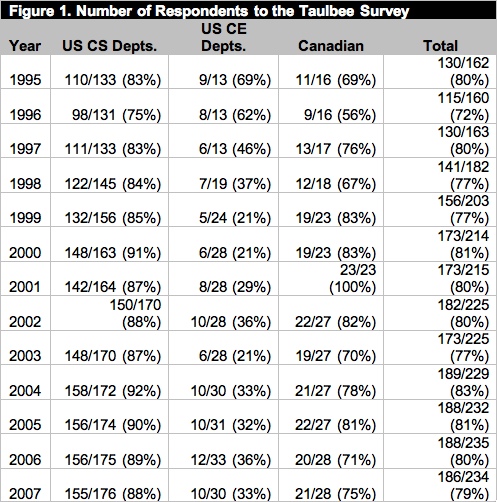
The data were collected from Ph.D.-granting departments only. We surveyed a total of 234 departments, one fewer than last year. Of these, 186 departments returned their survey forms, for a response rate of 79%. This is down slightly from last year’s 80%, but is still quite comprehensive (see Figure 1). The return rate of 10 out of 30 (33%) for CE programs is, as usual, very low. Many CE programs are part of an Electrical and Computer Engineering (ECE) department and do not keep separate statistics for CE vs. EE. In addition, many of these departments may not be aware of the Taulbee Survey or its importance. We again had a very good response rate from U.S. CS departments (155 of 176, or 88%), and a reasonable response rate (21 of 28, or 75%) from Canadian departments.
The set of departments responding varies slightly from year to year, even when the total numbers are about the same; thus, we must approach any trend analysis with caution. We must be especially cautious in using the data about CE departments because of the low response rate. Nevertheless, we continue to report CE departments separately because there are some significant differences between CS and CE departments.
The survey form itself is modified slightly each year to ensure a high rate of return (e.g., by simplifying and clarifying), while continuing to capture the data necessary to understand trends in the discipline and also reflect changing concerns of the computing research community. This year’s salary survey reports contain more information within the senior faculty ranks, as we can report many of the salaries based on number of years in rank.
Departments that responded to the survey were sent preliminary results for faculty salaries in December 2007; these results included additional distributional information not contained in this report. The CRA Board views this as a benefit of participating in the survey.
We thank all respondents who completed this year's questionnaire. Departments that participated are listed at the end of this article.
Ph.D. Degree Production and Enrollments (Tables 1-8)
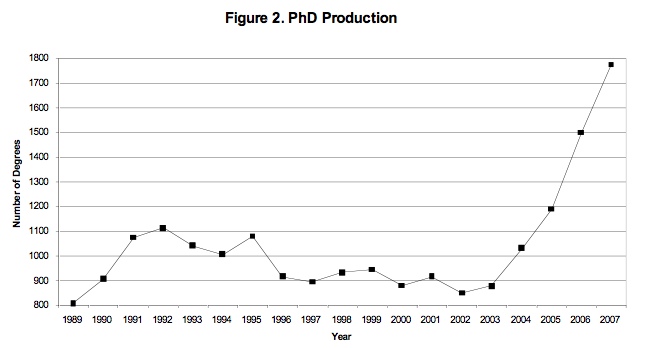
Ph.D. production continues to climb. A total of 1,775 new Ph.D.s were awarded between July 2006 and June 2007 (Table 1). This represents an increase of 18% over last year, and follows last year’s 26% increase over the previous year. This year’s production of more than 1,700 was predicted last year, and for the second straight year tracks the departments’ own estimates reasonably well. The “optimism ratio,” defined as the actual number divided by the predicted number, was 0.95, similar to last year’s 0.94. If this year’s optimism ratio holds again next year, there will be approximately 1,900 new Ph.D.s produced in 2007-2008. However, the rate of increase would be less than half this year’s rate.
The number of new students passing thesis candidacy exams (most, but not all, departments have such exams) declined 11%, although fewer departments reported such exams this year. However, even accounting for this smaller set of departments, the numbers are down. The number of students passing the qualifier also declined significantly (12%). This is an indication that Ph.D. production should begin declining in the next couple of years.
Longer term, Ph.D. production trends are less clear. The total number of new CS Ph.D. students (Table 5) rose by 4%, following four straight years of a decline in the number of new students. Most of this increase was due to existing Master’s level students becoming Ph.D. students, rather than the admission of a larger class of new students. Figure 3 shows a graphical view of the pipeline for computer science programs. The data in this graph are normalized by the number of departments reporting. The graph offsets the qualifier data by one year from the data for new students, and offsets the graduation data by five years from the data for new students. These data have been useful in estimating the timing of changes in production rates.
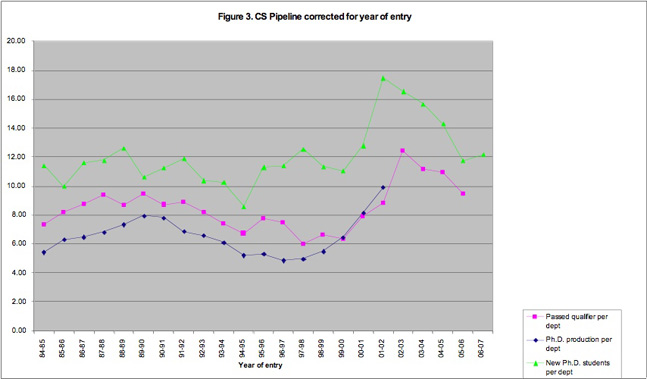
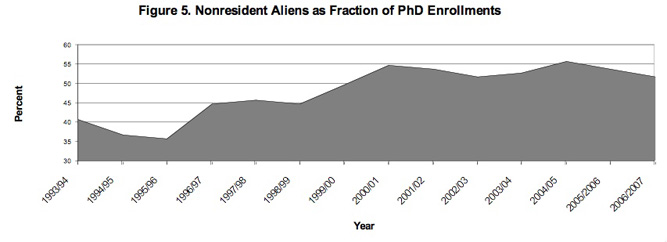
Table 5a reports the fall 2007 data for new students from outside North America. Top-ranked U.S. departments continue to have a somewhat higher fraction of domestic students than do lower-ranked departments, and Canadian departments have a lower percentage of Ph.D. students from outside North America than do their U.S. counterparts. However, this year, the distribution of new Ph.D. students who are not North American is more uniform across the ranks, ranging from 49% to 59% in U.S. programs. Among top-ranked U.S. programs, the fraction of new Ph.D. students from outside North America increased considerably. In Canadian programs, the fraction of new students who were not North American also rose. Overall, the fraction of new Ph.D. students who were not from North America rose from 53.1% in fall 2006 to 54.8% in fall 2007.
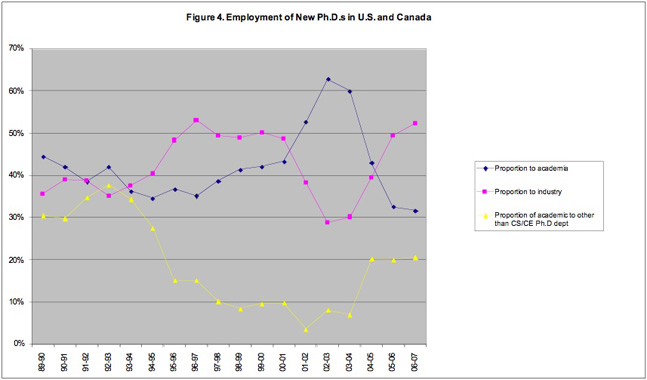
The trend toward employment in industry over academia continues for the 2006-07 Ph.D. graduates (Table 4) Table 4. Of those who reported employment, 32% chose academic employment in North America (compared to 33%, 43% and 60%, respectively, in the previous three years). There also is a continued decline in the percentage who went to tenure-track positions in Ph.D.- granting programs (11.4% vs 12.8%, 17.5% and 27.5% in the previous three years) and to non-Ph.D.-granting CS/CE departments (4.7% vs. 5.2% and 7.0% in the past two years). Nevertheless, the number of persons going into both types of positions stayed about the same. There were about the same number of new Ph.D.s going to postdoctoral positions as last year, although this also represents a somewhat smaller percentage of the total number of graduates. Industry hired 52.3% of new Ph.D. graduates, compared to 49.4% and 39.6% in the previous two years. Figure 4 shows the employment trend of new Ph.D.s in academia and industry, and the proportion of those going to academia who took positions in departments other than Ph.D.-granting CS/CE departments.
Despite the continued record Ph.D. production, unemployment of new Ph.D.s remains less than 1%. Perhaps surprisingly, the proportion of Ph.D. graduates who were reported taking positions outside of North America, among those whose employment is known, decreased this year from 13.1% to 10.0%.
Table 4 also indicates the areas of specialty of new CS/CE Ph.D.s. Year-to-year fluctuations among these data are common and multi-year trends are difficult to discern. This year, there was an increase in the software engineering area after a decline last year. There also was an increase in the graphics area and a more significant increase in the “unknown/other” category. It is not clear if departments are not tracking the areas in which graduates receive their degrees as carefully as they did previously, or if our survey is missing significant emerging areas.
For the second straight year, the proportion of women among new Ph.D.s rose to 19.1% in 2007 from 18.1% the previous year. Ethnicity characteristics of new Ph.D.s are similar to those reported last year (Table 3). There was an increase in the number of Hispanics, but this just offsets declines from last year. Collectively, African-American, Native-American/Alaskan Native, and Hispanics continue to account for less than 3% of the total.
Current Ph.D. enrollment proportions show similar gender and ethnicity breakdowns as they did last year (Tables 7 and 8). However, this year the number of students in the “Unknown” category increased markedly for both gender and ethnicity because a few departments did not report this information for any of their students.
Master's and Bachelor's Degree Production and Enrollments (Tables 9-16)
Master's degree production rose slightly this year, by 2%, following a 13% decline last year (Tables 9, 10). Predictions of the change in Master’s degrees in one year parallel the change in the number of Master’s students in the previous year. This year, enrollment in Master’s programs by new students (Table 13) is 2.6% higher than it was a year ago, suggesting another fairly small change in graduates next year. In contrast, the number of Master’s students was much higher than the number predicted last year by the departments themselves. Table 12 shows these predictions for this year.
Once again, there was very little difference in gender characteristics of Master’s recipients compared to last year’s survey. Consistent with the ethnicity changes in new Master’s students reported last year, the fraction of Master’s recipients this year who were Nonresident Aliens rose (from 47.3% to 52.5%). The fraction of Master’s recipients who were White, non-Hispanic dropped from 32.5% to 28.3%. These one-year “trends” are the reverse of those observed last year. The overall fraction of new Master’s students from outside North America remained about the same this year (56.5%), though increases were observed at U.S. departments ranked 13-36.
Bachelor's degree production (Tables 9 and 10) again was down significantly, by nearly 20% this year. This year’s decline is in line with the 16% decline estimated by the departments last year, and follows the declining trends in the number of new Bachelor’s students that have been reported widely in recent years.
Perhaps even more alarming is the drop in the fraction of Bachelor’s degrees awarded to women, from 14.2% last year to 11.8% this year (Table 9). The fraction of new female students is reported now to be less than 10% in many Bachelor’s programs. Ethnicity is also less diverse, with the proportion of White, non-Hispanics receiving Bachelor’s degrees rising to 66.0% from 59.6% just two years ago (Table 10). These are serious problems in achieving our field’s diversity goals.
Actual Bachelor’s degree production in departments reporting this year again was within 4% of the projection from last year’s reporting departments. From this year’s estimates (Table 11), it would appear that the number of Bachelor’s graduates in academic year 2007-08 will be about the same as we report for 2006-07.
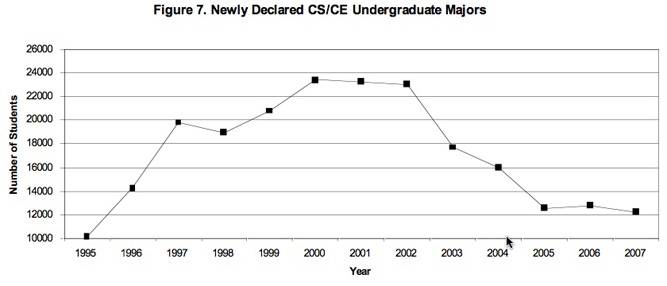
The number of new undergraduate majors fell by more than 4% this year, a disappointment following last year’s slight rise (see Table 14 and Figure 7). However, new majors in U.S. CS departments held steady; the decline is in the Canadian programs. In fact, the U.S. CS programs showed slight increases except for departments ranked 25-36.
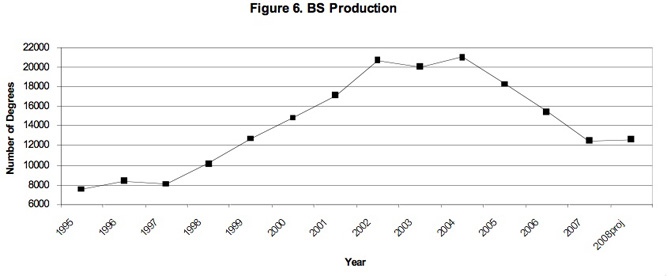
Total enrollment in Bachelor's programs (Table 16) continues its downward trend. This suggests additional declines in the number of Bachelor’s graduates, despite the mildly encouraging news each of the past two years in the number of new Bachelor’s students and despite departmental predictions of a similar number of Bachelor’s graduates for 2007-08 as we had in 2006-07. Enrollment today is more than 50% lower than it was five years ago.
Faculty Demographics (Tables 17-23)
Total faculty sizes held steady during the past year. Tenure-track faculty size is within 1% of last year’s value. Significant increases were observed in the number of researchers and postdocs, while there was a sharp decline in the number of teaching faculty. Coupled with the data in Table 4, it appears that postdocs may be staying longer in these positions than they have in the past
The fraction of women hired into tenure-track positions rose from 19.5% last year to 23.9% this year. This is a higher fraction than the 19.1% of female Ph.D.s produced (Table 2). The fraction of White, non-Hispanics hired into tenure-track positions rose from 43.0% last year to 48.3% this year. There also was an increase in Asian/Pacific Islanders, offset by a decrease in Nonresident Aliens. Disappointingly, only five tenure-track hires were reported among African Americans, Native Americans and Hispanics combined. Gender and ethnicity characteristics of current faculty are similar to those of last year (Tables 21 and 22).
Last year, the reporting departments predicted a 4% increase in faculty size. This year’s reporting departments forecast a 5% growth next year. Table 17 shows these predictions by category of faculty, Table 18 by ranking strata, and Table 18a by both (the latter for U.S. CS programs only). It is clear that expected faculty growth rates are modest these days.
Table 18b shows the recruiting results from last year’s hiring cycle. As was the case last year, the data indicate that roughly one of every three open tenure-track positions went unfilled last year. However, the top 24 U.S. CS departments and Canadian departments filled a smaller fraction of their vacant positions than did lower-ranked U.S. CS departments.
There appears to be more movement of faculty to new academic positions than in recent years. This year’s survey reported 103 such changes (Table 23), while the past two years reported 74 and 61, respectively. Other categories of faculty losses showed little change from last year.
Research Expenditures and Graduate Student Support (Tables 24-26)
Table 24-1 shows the department's total expenditure (including indirect costs or "overhead" as stated on project budgets) from external sources of support. Table 24-2 shows the per capita expenditure, where capitation is computed two ways. The first is relative to the number of tenured and tenure-track faculty members. The second is relative to researchers and postdocs, as well as tenured and tenure-track faculty. Canadian levels are shown in Canadian dollars. The data indicate that the higher the department’s ranking, the more external funding it receives (both in total and per capita).
Mean total expenditures declined slightly this year in all CS ranking strata except U.S. departments ranked greater than 36. Median total expenditures increased in U.S. departments ranked 1-12 and decreased in departments ranked 13-36. U.S. departments ranked 1-12 also improved with respect to per capita expenditures, as did Canadian departments, while U.S. departments ranked 25-36 declined. Other CS ranking strata showed mixed results with respect to per capita expenditures.
Table 25 shows the number of graduate students supported as full-time students as of fall 2007, further categorized as teaching assistants (TAs), research assistants (RAs), fellows, or computer systems supporters, and split between those on institutional vs. external funds. The number of TAs held steady again this year, with U.S. departments ranked 1-12 showing a strong increase and Canadian departments a correspondingly strong decrease. There are about the same number of RAs this year as there were last year, but there are significant differences among the ranking strata compared to last year. Among U.S. departments: those ranked 1-12 show considerable gains in both total and externally supported RAs and fewer RAs supported on institutional funds; departments ranked 13-24 show losses in total and externally supported RAs and gains in institutionally supported RAs; departments ranked 25-36 show a shift from externally supported to institutionally supported RAs, with little change in the total; and departments ranked greater than 36 show little change from last year in either externally or institutionally supported RAs. Canadian departments showed little change in externally supported RAs, but a significant decline in institutionally supported RAs. These changes generally are consistent with the changes in external research expenditures noted above.
The number of externally supported, full-support fellows is down considerably this year in U.S. departments ranked 1-12 and 25-36, and in Canadian departments. Some compensating gains in U.S. departments ranked 1-12 are observed in fellows supported institutionally.
Respondents were asked to "provide the net amount (as of fall 2007) of an academic-year stipend for a first-year doctoral student (not including tuition or fees)." The results are shown in Table 26. Canadian stipends are shown in Canadian dollars. The data show healthy stipend increases for TAs in U.S. departments ranked 1-12, slight increases in departments ranked greater than 36, decreases for TAs in departments ranked 13-24, and essentially no change in departments ranked 25-36. Canadian departments also showed an increase in stipends. There also are mixed results for RA stipends. Fellow stipends were fairly steady compared to last year, with U.S. departments ranked 25-36 showing the greatest increases.
Faculty Salaries (Tables 27-34)
Each department was asked to report individual (but anonymous) faculty salaries if possible; otherwise, the department was requested to provide the minimum, median, mean, and maximum salaries for each rank (full, associate, and assistant professors and non-tenure-track teaching faculty), and the number of persons at each rank. The salaries are those in effect on January 1, 2008. For U.S. departments, nine-month salaries are reported in U.S. dollars. For Canadian departments, twelve-month salaries are reported in Canadian dollars. Respondents were asked to include salary supplements such as salary monies from endowed positions.
The tables contain data about ranges and measures of central tendency only. Departments reporting individual salaries were provided more comprehensive distributional information in December 2007. A total of 148 departments (85% of those reporting salary data) provided salaries at the individual level.
It is well known that, particularly at the associate professor level, time in rank is an important element when trying to draw comparisons in salaries. Therefore, this year we obtained information about time in rank for associate and full professors. Thus the salary tables this year are more comprehensive than those of prior years.
The minimum and maximum of the reported salary minima (and maxima) are self-explanatory. The range of salaries in a given rank among departments that reported data for that rank is the interval ["minimum of the minima," "maximum of the maxima"]. The mean of the reported salary minima (maxima) in a given rank is computed by summing the departmental reported minimum (maximum) and dividing by the number of departments reporting data at that rank.
The median salary at each rank is the average of the median salaries reported at that rank by each of the departments. Thus, it is not a true median of all the salaries. The average salary at each rank is computed by summing the individual means reported at each rank and dividing by the number of departments reporting at that rank. Thus, it is not a true average of all the salaries.
Overall U.S. CS average salaries (Table 27) 3.6% and 4.6%, depending on tenure-track rank, and 6.8% for non-tenure-track teaching faculty. These increases are somewhat similar to the levels experienced in the past two years for tenure-track faculty, and exceed the 4.2% and 4.8% levels for non-tenure-track teaching faculty from these two years. Full professors received larger average increases this year than did faculty of lower rank at lower-ranked departments, with associate professors receiving the highest average salary increases at rank 1-24 departments. Canadian salaries (Table 33) rose 1.5% to 4.7%, with the greater increase at the full professor rank and the smaller at the assistant professor rank. Non-tenure-track teaching faculty salaries for Canadian departments rose 6.8%, the same increase as was observed for U.S. CS programs.
Average salaries for new Ph.D.s (those who received their Ph.D. last year and then joined departments as tenure-track faculty) increased 3% from those reported in last year’s survey (Table 34). This is the same level of increase observed last year for new Ph.D.s. and, as has been the case in recent years, is somewhat smaller than the average increases for continuing faculty. New Ph.D. salaries in Canadian departments rose 1.5%, to $83,043 for twelve months in tenure-track positions, which is the same level of increase as for Canadian assistant professors overall. However, this is based on only six data points, so we do not show a separate table for new Ph.D.s in the Canadian departments.
Concluding Observations
We have not yet reached the peak of Ph.D. production, although we appear to be getting close. Most of the Ph.D. graduates continue to go to industry, with the number of available academic positions changing little in the past three years.
Undergraduate degree production continues its downward trend, although this trend should cease within the next two years, at least in U.S. CS departments. However, signs of recovery from the sharp decline that has lasted several years have yet to materialize.
Rankings
For tables that group computer science departments by rank, the rankings are based on information collected in the 1995 assessment of research and doctorate programs in the United States conducted by the National Research Council [see http://www.cra.org/statistics/nrcstudy2/home.html]. New NRC rankings are anticipated later in 2008, and future Taulbee reports may be modified as a result.
The top twelve schools in this ranking are: Stanford, Massachusetts Institute of Technology, University of California (Berkeley), Carnegie Mellon, Cornell, Princeton, University of Texas (Austin), University of Illinois (Urbana-Champaign), University of Washington, University of Wisconsin (Madison), Harvard, and California Institute of Technology. All schools in this ranking participated in the survey this year.
CS departments ranked 13-24 are: Brown, Yale, University of California (Los Angeles), University of Maryland (College Park), New York University, University of Massachusetts (Amherst), Rice, University of Southern California, University of Michigan, University of California (San Diego), Columbia, and University of Pennsylvania.[2] All schools in this ranking participated in the survey this year.
CS departments ranked 25-36 are: University of Chicago, Purdue, Rutgers, Duke, University of North Carolina (Chapel Hill), University of Rochester, State University of New York (Stony Brook), Georgia Institute of Technology, University of Arizona, University of California (Irvine), University of Virginia, and Indiana. All schools in this ranking participated in the survey this year.
CS departments that are ranked above 36 or that are unranked that responded to the survey include: Arizona State University, Auburn, Boston University, Brandeis, City University of New York Graduate Center, Clemson, College of William and Mary, Colorado School of Mines, Colorado State, Dartmouth, DePaul, Drexel, Florida Institute of Technology, Florida International, Florida State, George Mason, George Washington, Georgia State, Illinois Institute of Technology, Iowa State, Johns Hopkins, Kansas State, Kent State, Lehigh, Louisiana State, Michigan State, Michigan Technological, Mississippi State, Montana State, Naval Postgraduate School, New Mexico State, New Mexico Technology, North Carolina State, North Dakota State, Northeastern, Northwestern, Nova Southeastern, Ohio State, Oklahoma State, Old Dominion, Oregon Health and Science, Oregon State, Pace, Pennsylvania State, Polytechnic, Portland State, Rensselaer Polytechnic, State University of New York (Binghamton), Stevens Institute of Technology, Syracuse, Texas A&M, Texas Tech, Toyota Technological Institute (Chicago), Tufts, Vanderbilt, Virginia Tech, Washington State, Washington (St. Louis), Wayne State, West Virginia, Worcester Polytechnic, and Wright State.
University of: Alabama (Birmingham, Huntsville, and Tuscaloosa), Albany, Arkansas (Fayetteville and Little Rock), Buffalo-SUNY, California (at Davis, Riverside, Santa Barbara, and Santa Cruz), Cincinnati, Colorado (Boulder), Connecticut, Delaware, Denver, Florida, Georgia, Illinois (Chicago), Iowa, Kansas, Kentucky, Louisiana (Lafayette), Louisville, Maine, Maryland (Baltimore Co.), Massachusetts (at Boston and Lowell), Minnesota, Mississippi, Missouri (at Columbia and Kansas City), Nebraska (Lincoln and Omaha), Nevada (Las Vegas and Reno), New Hampshire, New Mexico, North Carolina (Charlotte), North Texas, Notre Dame, Oklahoma, Oregon, Pittsburgh, South Carolina, South Florida, Tennessee (Knoxville), Texas (at Arlington, Dallas, El Paso, and San Antonio), Tulsa, Utah, and Wisconsin (Milwaukee).
Computer Engineering departments participating in the survey this year include: Boston University, Iowa State, Northeastern, Princeton, Purdue, Rensselaer Polytechnic, Virginia Tech, and the Universities of California (Santa Barbara and Santa Cruz) and New Mexico.
Canadian departments participating in the survey include: Concordia, Dalhousie, McGill, Memorial, Queen's, and Simon Fraser universities. University of: Alberta, British Columbia, Calgary, Manitoba, Montreal, New Brunswick, Regina, Saskatchewan, Toronto, Victoria, Waterloo, and Western Ontario, and Université Laval.
Acknowledgments
Betsy Bizot once again provided valuable assistance with the data collection, tabulation, and analysis for this survey. Jean Smith and Moshe Vardi suggested many valuable improvements to the presentation of this report.
Endnotes
1. The title of the survey honors the late Orrin E. Taulbee of the University of Pittsburgh, who conducted these surveys for the Computer Science Board until 1984, with retrospective annual data going back to 1970.
2. Although the University of Pennsylvania and the University of Chicago were tied in the National Research Council rankings, CRA made the arbitrary decision to place Pennsylvania in the second tier of schools.
3. All tables with rankings: Statistics sometimes are given according to departmental rank. Schools are ranked only if they offer a CS degree and according to the quality of their CS program as determined by reputation. Those that only offer CE degrees are not ranked, and statistics are given on a separate line, apart from the rankings.
4. All ethnicity tables: Ethnic breakdowns are drawn from guidelines set forth by the U.S. Department of Education.
5. All faculty tables: The survey makes no distinction between faculty specializing in CS vs. CE programs. Every effort is made to minimize the inclusion of faculty in electrical engineering who are not computer engineers.
Copyright © 2007 Computing Research Association. All Rights Reserved. Questions? E-mail: webmaster@cra.org.