THIS IS AN ARCHIVED VERSION OF CRA'S WEBSITE. THIS ARCHIVE IS AVAILABLE TO PROVIDE HISTORICAL CONTENT.
PLEASE VISIT HTTP://WWW.CRA.ORG FOR THE LATEST INFORMATION
| About CRA |
| Membership |
| CRA for Students |
| CRA for Faculty |
| CRA-Women |
| Computing Community Consortium (CCC) |
| Awards |
| Projects |
| Events |
| Jobs |
| Government Affairs |
| Computing Research Policy Blog |
| Publications |
| Data & Resources |
| CRA Bulletin |
| What's New |
| Contact |
| Home |

<< Back to May 2007 CRN Table of Contents
<< Back to Taulbee Survey home page
>> See also: Continued Drop in CS Bachelor's Degree Production and Enrollments as the Number of New Majors Stabilizes
[Published originally in the May 2007 edition of Computing Research News, Vol. 19/No. 3]
2005-2006 Taulbee Survey
Record Ph.D. Production Continues; Undergraduate Enrollments Turning the Corner
By Stuart Zweben
This article and the accompanying figures and tables present the results of the 36th annual CRA Taulbee Survey[1] of Ph.D.-granting departments of computer science (CS) and computer engineering (CE) in the United States and Canada. This survey is conducted annually by the Computing Research Association to document trends in student enrollment, employment of graduates, and faculty salaries.
Information is gathered during the fall. Responses received by January 22, 2007 are included in the analysis. The period covered by the data varies from table to table. Degree production and enrollment (Ph.D., Master's, and Bachelor's) refer to the previous academic year (2005-2006). Data for new students in all categories refer to the current academic year (2006-2007). Projected student production and information on faculty salaries and demographics also refer to the current academic year. Faculty salaries are those effective January 1, 2007.
The data were collected from Ph.D.-granting departments only. A total of 235 departments were surveyed, three more than last year. As shown in Figure 1, 188 departments returned their survey forms, for a response rate of 80%. This is down slightly from last year’s 81%, but is still quite comprehensive. The return rate of 12 out of 33 (36%) for CE programs is, as usual, very low. Many CE programs are part of an Electrical and Computer Engineering (ECE) department and do not keep separate statistics for CE vs. EE. In addition, many of these departments are not aware of the Taulbee Survey or its importance. The response rate for US CS departments (156 of 175, or 89%) again was very good, and there was only a fair response rate (20 of 28, or 71%) from Canadian departments.
The set of departments responding varies slightly from year to year, even when the total numbers are about the same; thus, we must approach any trend analysis with caution. We must be especially cautious in using the data about CE departments because of the low response rate. Nevertheless, we continue to report CE departments separately because there are some significant differences between CS and CE departments.
The survey form itself is modified slightly each year to ensure a high rate of return (e.g., by simplifying and clarifying), while continuing to capture the data necessary to understand trends in the discipline and also reflect changing concerns of the computing research community. This year, the survey included questions about department space, sources of external funding, support staff, grad student recruiting methods, and teaching loads. These questions are added to the survey only every third year because the data in these areas change slowly.
There are some new reports generated this year in the area of faculty demographics. See that section for details.
Departments that responded to the survey were sent preliminary results about faculty salaries in December 2006; these results included additional distributional information not contained in this report. The CRA Board views this as a benefit of participating in the survey.
We thank all respondents who completed this year's questionnaire. Departments that participated are listed at the end of this article.
Ph.D. Degree Production and Enrollments (Tables 1-8)
Last year, we reported record Ph.D. production of 1,189. This year, another record crop of Ph.D.s was produced. The total Ph.D. production between July 2005 and June 2006 of 1,499 (Table 1) represents a phenomenal 26% increase. While last year’s report anticipated a new record, the magnitude of the increase was not anticipated. Even with the 26% growth, departments last year overestimated the number of Ph.D.s that would be produced. But the “optimism ratio,” defined as the actual number divided by the predicted number, was 0.94, well in excess of the 0.80 and 0.76 ratios from the past two years. If this year’s optimism ratio holds again next year, there will be more than 1,700 new Ph.D.s produced in 2006-2007.
The number of new students passing thesis candidacy exams (most, but not all, departments have such exams) rose 19%. This is an indication that more record production is in store in the near term.
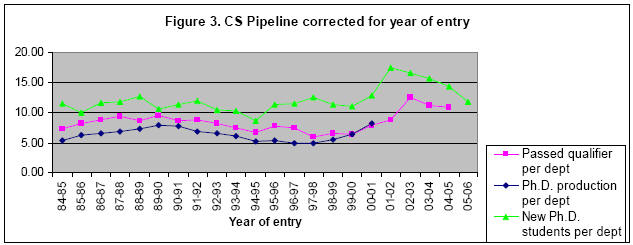
Longer term, Ph.D. production should ease. The number of students who passed the qualifier declined 5%, and the total number of new Ph.D. students (Table 5) declined more than 6% (the fourth straight year of a decline in number of new students). Figure 3 shows a graphical view of the pipeline for the computer science programs. The data in this graph are normalized by the number of departments reporting to the survey. The graph offsets the qualifier data by one year from the data for new students, and offsets the graduation data by five years from the data for new students. As mentioned in previous reports, these data can be useful in estimating the timing of changes in production rates.
This is the second year we obtained information about the number of new students who come from outside North America. Table 5a reports the data for the fall 2006 class. Top-ranked U.S. departments continue to have a somewhat higher fraction of domestic students than do lower-ranked departments, and Canadian departments have a lower percentage of Ph.D. students from outside North America than do their U.S. counterparts. In fact, each of these differences grew during the past year.
Table 4 shows employment for new Ph.D. recipients. Of those who reported employment, only one-third took academic employment in North America (compared to 43% last year and 60% the year before). Again, most of these academic positions were in Ph.D.-granting departments, and once more there was a decline in the percentage who went into tenure-track positions (12.8% vs. 17.5% last year and 27.5% the year before). There was a slight decline this year in the number (66 vs. 72 last year) and percentage (5.2% vs. 7.0% last year) of those who went to other CS/CE departments. Nevertheless, the 66 figure still is more than twice that of just two years ago. The data on employment in postdoctoral positions were similar to last year.
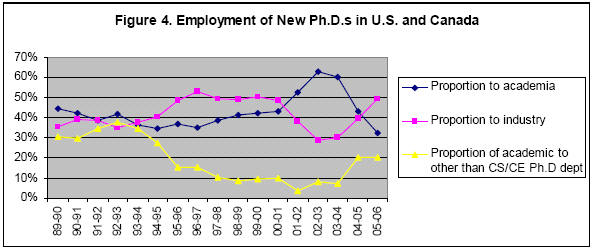
There was a large increase (49.4% vs. 39.6% last year) in the fraction of new Ph.D.s going to industry. Figure 4 shows the employment trend of new Ph.D.s in academia and industry, and the proportion of those going to academia who took positions in other than Ph.D.-granting CS/CE departments. As was the case during the dot-com boom years, industry is taking a much larger share of new Ph.D.s than is academia.
The continued record Ph.D. production has not resulted in higher unemployment among new Ph.D.s. In fact, the reported unemployment is even lower than last year (0.7% vs. 1.5% last year). Among those whose employment is known, the proportion (13.1%) of Ph.D. graduates who were reported taking positions outside North America is higher than last year for the second year in a row.
The data in Table 4 also indicate the areas of specialty of new CS/CE Ph.D.s. Year-to-year fluctuations among these data are common and multi-year trends are difficult to discern. This year, there was a huge increase in the OS/networks area and a decline in the software engineering area. There also was an increase in the “unknown/other” category. It may be necessary to examine the categories being used to see if they are missing significant emerging areas.
The proportion of women among new Ph.D.s rose to 18.1% in 2006 after falling to 14.7% in 2005 (Table 2). This year’s proportion is about the same as it was two years ago. The proportion of nonresident alien Ph.D.s rose from 53.4% in 2005 to 56.8% in 2006 (Table 3). Just two years ago this fraction was only 48.2%. This increase comes mainly at the expense of White, non-Hispanics. African-American, Native-American/Alaskan Native, and Hispanics collectively accounted for only 2.7% of the total, about the same as two years ago and down slightly from last year.
Current Ph.D. enrollment proportions are similar this year to those of last year. This is true for both gender and ethnicity proportions (Tables 7 and 8).
Master's and Bachelor's Degree Production and Enrollments (Tables 9-16)
While Ph.D. production was at a record high, Master's and Bachelor’s degree production dropped significantly. Master’s degree production was down 13%, from 9,286 in the year ending June 2005 to 8,074 in the year ending June 2006 (Tables 9, 10). This is reasonably consistent with the 17% drop in new Master’s students reported two years ago.
There was very little difference in gender characteristics of Master’s recipients compared to last year’s survey. A slightly higher percentage of Master’s recipients reported this year were White, non-Hispanic, while there was a corresponding decrease in the percentage of Nonresident Alien recipients. Actual Master’s degrees awarded were within 2% of last year’s projections. This year's projections by the departments would suggest another decline of nearly 10% in Master’s production for the current academic year.
Enrollment in Master’s programs by new students (Table 13) is about the same as last year, while total enrollment (Table 15) is down by more than 10% (all attributable to declines in computer science Master’s programs). The proportion of new Master’s students coming from outside North America rose from 46.5% last year to 56.7% this year. As was the case for new Ph.D. students, top departments have a greater proportion of new domestic Master’s students than lower-ranked departments.
Bachelor's degree production was down more than 15%, following the 13% decrease reported last year. These decreases are predictable from the significantly decreased enrollments in undergraduate programs that have been observed in recent surveys and reported widely in the media. The proportion of Bachelor’s degrees awarded to women was about the same as last year. There also was another increase in the proportion of White, non-Hispanics receiving Bachelor’s degrees, from 59.6% to 62.6%, and another corresponding decrease in the proportion of Asian/Pacific Islanders receiving these degrees.
Actual Bachelor’s degree production in departments reporting this year was only 3.1% lower than the projection from last year’s reporting departments. From this year’s estimates, it would appear that another 16% decline is looming. If this holds true, it would represent a drop of more than 40% over a three-year period.
The news is much better when looking at new Bachelor’s degree students. For the first time in four years, the number of new undergraduate majors is slightly higher than the corresponding number last year (see Table 14 and Figure 7). This holds true when looking at only the more robust computer science numbers. The number of new computer science pre-majors is up nearly 10%. Perhaps these are signs of renewed interest in the undergraduate computer science major. One should not jump to conclusions based on one year’s data, but the cessation of declining numbers of new students is welcomed by our computer science programs.
Total enrollment in Bachelor's programs (Table 16) is down 14% from last year, echoing the drop reported in last year’s survey. Enrollment today is more than 40% lower than it was four years ago.
Faculty Demographics (Tables 17-23)
Total faculty sizes fell by 4% during the past year. All categories except postdocs experienced a decline. Tenure-track faculty, the dominant category, fell 3% to nearly the level of two years ago. In view of the record Ph.D. production, it appears the effects of reduced enrollments in our undergraduate programs have had an impact on faculty hiring. It should be noted, however, that departments ranked 13-36 did grow by more than 8% in aggregate.
Last year, the reporting departments predicted a 6% increase in faculty size, so the decline may have surprised many. Last year’s predictions were unmet in all categories of faculty, although ranks 13-36 came very close. Departments reporting this year forecast a slightly more modest 4% growth for next year. If achieved, this will return sizes to last year’s level. We’ll see.
Table 18a is new this year. It shows the faculty demographics for each of the U.S. CS ranking strata. The table illustrates that higher ranked departments tend to have more tenure-track faculty members and more postdocs than do lower ranked departments. If the growth forecasts hold true, departments ranked 13-36 will be hiring more postdocs in the next two years than will the top 12 departments.
Table 18b also is new this year, and shows the recruiting results from last year’s hiring cycle. The data indicate that roughly one of every three open tenure-track positions went unfilled last year. In future years, trends in these data will be of interest to our community.
Table 23 on faculty “losses” shows no change (100 vs. 103 last year) in the number who left academia this past year through death, retirement, or taking nonacademic positions. In particular, the retirement number stayed about the same. The amount of “churn,” the number of professors moving from one academic position to another, rose somewhat from 61 to 74, but this is less than 2% of the total size of the tenure-track faculty.
The percentage of newly hired women faculty (Table 19) dropped slightly from 22% to 19.6%; the proportion of women hired into tenure-track positions mirrors that for all faculty positions. These proportions of new women faculty are similar to the 18.1% proportion of new female Ph.D.s shown in Table 2.
The proportion of White, non-Hispanic tenure-track hires stayed the same this year, while the proportion of nonresident aliens and African-Americans increased and the proportion of Asian/Pacific Islanders hired decreased. The trend of disproportionately fewer nonresident aliens being hired into tenure-track faculty positions (28.5%) compared to nonresident aliens’ proportion of the new Ph.D.s produced (56.8%) continues. The increased proportion of newly hired African-Americans (3.3% of faculty hires with known ethnicity, compared to 1.3% last year) is welcome in addressing diversity concerns. Nevertheless, with African-Americans comprising only 1.8% of our current Ph.D. enrollments (Table 8), it is not likely that this is a sustainable increase.
Tables 21 and 22 show gender and ethnicity data for all categories of current faculty, including postdocs. The proportion of female tenured faculty rose slightly this year (10.4% full professors vs. 9.8% last year; 13.1% associate professors vs. 12.5% last year), and the proportion of female postdocs also rose (19.6% vs. 16.7% last year). There is a smaller proportion of non-resident aliens as assistant professors and as postdocs compared to last year, while the proportion of postdocs who are Asian/Pacific Islanders and White, Non-Hispanic rose.
Research Expenditures and Graduate Student Support (Tables 24-26)
Table 24-1 shows the department's total expenditure (including indirect costs or "overhead" as stated on project budgets) from external sources of support. Table 24-2 shows the per capita expenditure, where capitation is computed two ways. The first is relative to the number of tenured and tenure-track faculty members, which also was the method used historically in the survey. The second is relative to researchers and postdocs, as well as tenured and tenure-track faculty. In general, the higher the ranking of the department, the higher the amount of external funding it receives (both in total and per capita). However, departments ranked 13-24 are close to the top 12 in median total funding and, in fact, are higher in median funding when the first capitation method is used. Canadian levels are shown in Canadian dollars.
Mean and median expenditures—both in total and on a per capita basis (no matter which capitation method is used)—declined for the top 12 U.S. departments for the second year in a row. Median expenditures for all U.S. CS department strata declined using the first capitation method, while other U.S. CS strata stayed about the same as last year using the second capitation method. Means and median expenditures for Canadian departments and computer engineering departments rose using either capitation method. While the details are somewhat different, the overall message stated in last year’s report still holds: “These mixed reports suggest that it has become harder for faculty to obtain and/or sustain funding for computing research in the U.S. CRA has reported on the funding story extensively through the years, and these data are consistent with the declining state of research funding that has been noted recently.”
Table 25 shows the number of graduate students supported as full-time students as of fall 2006, further categorized as teaching assistants, research assistants, fellows, or computer systems supporters, and split between those on institutional vs. external funds. The number of teaching assistants held steady this year, except in departments ranked 25-36 and computer engineering departments where it increased, and in Canadian departments where it declined. Total number of research assistants fell, although the number supported on external funds rose. This shift from institutional to external support is predominant in departments ranked 1-24.
After a decline of more than 10% last year, the number of full-support fellows is up substantially this year. Canadian departments explain the entire change at the institutional support level, but less than 25% of the change in fellows were supported on external funds.
Respondents were asked to "provide the net amount (as of fall 2006) of an academic-year stipend for a first-year doctoral student (not including tuition or fees)." The results are shown in Table 26. Canadian stipends are shown in Canadian dollars. Because some departments report this information in some years and not others, the data within the various ranking strata may only be a weak indicator of the actual stipend changes from one year to the next. The data show approximately a 5% to 6% increase in median teaching assistant (TA) salaries in all U.S. ranking strata except departments ranked 13-24, which showed a 9% decrease. Canadian departments showed a small decline in median TA stipends.
The effect on Research assistant (RA) stipends is similar to the teaching assistant stipends, according to reporting departments. Median salaries for RAs were flat for U.S. departments ranked 13-24, and rose about 2% to 8% in other U.S. ranking strata. Canadian median stipends dropped significantly, undoubtedly more seriously affected by the differences in departments that reported this information.
Faculty Salaries (Tables 27-34)
Each department was asked to report individual (but anonymous) faculty salaries if possible; otherwise, the department was requested to provide the minimum, median, mean, and maximum salaries for each rank (full, associate, and assistant professors and non-tenure-track teaching faculty) and the number of persons at each rank. The salaries are those in effect on January 1, 2007. For U.S. departments, nine-month salaries are reported in U.S. dollars. For Canadian departments, twelve-month salaries are reported in Canadian dollars. Respondents were asked to include salary supplements such as salary monies from endowed positions.
Here we report tables comparable to those used in previous Taulbee surveys. The tables contain data about ranges and measures of central tendency only. Those departments reporting individual salaries were provided more comprehensive distributional information in December 2006. A total of 152 departments (82% of those reporting salary data) provided salaries at the individual level.
The minimum and maximum of the reported salary minima (and maxima) are self-explanatory. The range of salaries in a given rank among departments that reported data for that rank is the interval ["minimum of the minima," "maximum of the maxima"]. The mean of the reported salary minima (maxima) in a given rank is computed by summing the departmental reported minimum (maximum) and dividing by the number of departments reporting data at that rank.
The median salary at each rank is the middle of the list if you order its members’ mean salaries at that rank from lowest to highest, or the average of the middle two numbers if there is an even number of items in the set. The average salary at each rank is computed by summing the individual means reported at each rank and dividing by the number of departments reporting at that rank. We recognize that these means and medians are only approximations to the true means and medians for their rank.
Overall U.S. CS average salaries (Table 27) increased between 2.7% and 4.7%, depending on tenure-track rank, and 4.2% for non-tenure-track teaching faculty. These increases are somewhat similar to the 3.7% to 4.1% levels experienced last year for tenure-track faculty and the 4.8% level for non-tenure-track teaching faculty. Tenure-track faculty of higher rank tended to get larger increases this year than did those of lower rank. Canadian salaries (shown as 12-month salaries in Canadian dollars) rose 2.3% to 4.4%, with the larger increase at the full professor rank and the smaller at the associate professor rank.
Average salaries for new Ph.D.s (those who received their Ph.D. last year and then joined departments as tenure-track faculty) increased 3% from those reported in last year’s survey (Table 34). This level of increase is somewhat smaller than the average increases for continuing faculty, for the third year out of the past four.
Additional Departmental Profiles Analysis
Every three years, CRA collects additional information about various aspects of departmental activities that are not expected to change much over a one-year period. The additional data include teaching loads, sources of external funding, methods of recruiting graduate students, departmental support staff, and space. The most recent data about these activities were collected in the 2003 Taulbee Survey, and reported in the May 2004 edition of Computing Research News.
Teaching Loads (Tables 35-38)
Average official teaching loads range from two to a little more than three semester courses per faculty member per year. The overall mean load of 3.1 courses is lower than the 3.5 value three years ago. Almost all departments report that there are factors that cause the load for an individual faculty member to vary. Compared with three years ago, a smaller percentage of departments report allowing reduction for administrative duties (75.9% vs. 84.1%) or the type or size of class being taught (18.2% vs 29.0%), while other factors show percentages this year similar to those reported three years ago. This year, 75.6% of departments reported that increases from the standard load take place for faculty members who shift their primary responsibility to teaching; this fraction was 70.3% three years ago.
Sources of External Funding (Tables 39-44)
NSF continues to be the dominant source of external funding for U.S. computer science programs. NSF’s share of this funding, compared with three years ago, increased by about 3% in all ranking strata except 13-24, where it increased 7%. DARPA had a larger share of the funding for top 12 departments (21.6% vs 14.3% three years ago), while other U.S. ranking strata showed a decline in the fraction of support obtained from DARPA. NIH’s share was higher in the top 36 departments, and slightly lower for other U.S. departments. DOE’s share went up somewhat in all strata except 25-36. The funding share from other defense agencies was generally lower except for top 12 departments, while the funding share from industry was somewhat higher except for top 12 departments. Table 44a shows the aggregate comparisons among all U.S. CS departments for each source of funding.
Canadian departments continue to get just over 40% of their funding from NSERC. Provincial agencies’ share of the external funding declined from about one-third to about one-quarter, while share of support from industry and other federal agencies rose.
This year, the tables report mean dollar amounts of funding from each source for all departments that reported in the stratum and among those who reported non-zero values from the funding source. Also shown is the fraction of departments within the stratum that reported any funding from that source. The data about non-zero departments was not reported three years ago.
Methods of Recruiting Graduate Students (Tables 45-47)
Graduate student stipends continue to be affected more by advancement to the next stage of the graduate program than by factors such as years of service, GPA, recruitment enhancements, or differences in funding source. Nevertheless, the fraction of departments that reported using recruitment enhancements and differences among funding sources as the basis for stipends was markedly lower this year than three years ago (13.9% vs 24.4% for recruiting enhancements, and 28.3% vs 44.8% for funding source differences). Stipend enhancements appear to be used as a recruiting incentive at a greater fraction of departments this year (30.6% vs 20.3% three years ago). Mean stipend enhancements are now around $5,000 compared with $3,238 three years ago.
Departmental Support Staff (Tables 48-50)
Support staff has not changed much from the data reported three years ago. All categories (administrative, computer, and research) show mean values that are similar to those reported the last time these data were collected.
Space (Tables 51-63)
Higher ranked U.S. computer science departments have more total space than lower ranked departments (Table 51). Median space growth during the past three years is generally 5% to 6%, except that median space grew by 16% for top 12 departments. Most of the growth appears to have been in office space and research lab space. Median instructional lab space grew for lower ranked departments, while it declined for higher ranked departments.
While half of the departments planned to get additional space three years ago, only about one quarter plan for space growth now. Where new space is being planned, it generally is office space and research lab space.
Concluding Observations
Ph.D. production continues to set records, and the forecast is for this to continue for the next year or two. More Ph.D. graduates are going to industry than to academia, and more are taking positions outside of North America. Total faculty sizes and research funding levels have temporarily, at least, hit a plateau, and there is as yet no evidence of increasing rates of faculty retirement.
While total undergraduate enrollments and degree production continue to decline, the decline in the number of new students at the bachelor’s level seems to have ended. If the enrollments of new undergraduate students in computer science programs do, in fact, trend upward, faculty growth again should be possible. In the near term, however, the market looks very good for those departments who are able to hire new Ph.D.s.
Rankings
For tables that group computer science departments by rank, the rankings are based on information collected in the 1995 assessment of research and doctorate programs in the United States conducted by the National Research Council [see /statistics/nrcstudy2/home.html].
The top twelve schools in this ranking are: Stanford, Massachusetts Institute of Technology, University of California (Berkeley), Carnegie Mellon, Cornell, Princeton, University of Texas (Austin), University of Illinois (Urbana-Champaign), University of Washington, University of Wisconsin (Madison), Harvard, and California Institute of Technology. All schools in this ranking participated in the survey this year.
CS departments ranked 13-24 are: Brown, Yale, University of California (Los Angeles), University of Maryland (College Park), New York University, University of Massachusetts (Amherst), Rice, University of Southern California, University of Michigan, University of California (San Diego), Columbia, and University of Pennsylvania.[2] All schools in this ranking participated in the survey this year.
CS departments ranked 25-36 are: University of Chicago, Purdue, Rutgers, Duke, University of North Carolina (Chapel Hill), University of Rochester, State University of New York (Stony Brook), Georgia Institute of Technology, University of Arizona, University of California (Irvine), University of Virginia, and Indiana. All schools in this ranking participated in the survey this year.
CS departments that are ranked above 36 or that are unranked that responded to the survey include: Arizona State University, Auburn, Boston University, Brandeis, City University of New York Graduate Center, Clemson, College of William and Mary, Colorado School of Mines, Colorado State, Dartmouth, DePaul, Drexel, Florida Institute of Technology, Florida International, Florida State, George Mason, George Washington, Georgia State, Illinois Institute of Technology, Iowa State, Johns Hopkins, Kansas State, Kent State, Lehigh, Louisiana State, Michigan State, Michigan Technological, Mississippi State, Montana State, Naval Postgraduate School, New Mexico State, New Mexico Technology, North Carolina State, North Dakota State, Northeastern, Northwestern, Nova Southeastern, Ohio State, Oklahoma State, Old Dominion, Oregon Health and Science, Oregon State, Pace, Pennsylvania State, Polytechnic, Portland State, Rensselaer Polytechnic, State University of New York (Binghamton), Stevens Institute of Technology, Syracuse, Texas A&M, Texas Tech, Toyota Technological Institute (Chicago), Tufts, Vanderbilt, Virginia Tech, Washington State, Washington (St. Louis), Wayne State, West Virginia, Worcester Polytechnic, and Wright State.
University of: Alabama (Birmingham, Huntsville, and Tuscaloosa), Albany, Arkansas (Little Rock), Buffalo, California (at Davis, Riverside, Santa Barbara, and Santa Cruz), Central Florida, Colorado (at Boulder and Denver), Connecticut, Delaware, Florida, Georgia, Hawaii, Illinois (Chicago), Iowa, Kansas, Kentucky, Louisiana (Lafayette), Louisville, Maine, Maryland (Baltimore Co.), Massachusetts (at Boston and Lowell), Minnesota, Mississippi, Missouri (at Columbia, Kansas City and Rolla), Nebraska (Lincoln and Omaha), Nevada (Las Vegas and Reno), New Hampshire, New Mexico, North Carolina (Charlotte), North Texas, Notre Dame, Oklahoma, Oregon, Pittsburgh, South Carolina, South Florida, Tennessee (Knoxville), Texas (at Arlington, Dallas, El Paso, and San Antonio), Toledo, Tulsa, Utah, Wisconsin (Milwaukee) and Wyoming.
Computer Engineering departments participating in the survey this year include: Iowa State, Northeastern, Princeton, Purdue, Rensselaer Polytechnic, Santa Clara, Virginia Tech, and the Universities of California (Santa Cruz), Houston, New Mexico, Southern California, and Tennessee (Knoxville).
Canadian departments participating in the survey include: Concordia, Dalhousie, McGill, Memorial, Queen's, and Simon Fraser universities. University of: Alberta, British Columbia, Calgary, Manitoba, Montreal, New Brunswick, Regina, Saskatchewan, Toronto, Victoria, Waterloo, and Western Ontario, and Université Laval.
Acknowledgments
Betsy Bizot once again provided valuable assistance with the data collection, tabulation, and analysis for this survey. Jean Smith and Moshe Vardi suggested many valuable improvements to the presentation of this report.
Endnotes
1. The title of the survey honors the late Orrin E. Taulbee of the University of Pittsburgh, who conducted these surveys for the Computer Science Board until 1984, with retrospective annual data going back to 1970.
2. Although the University of Pennsylvania and the University of Chicago were tied in the National Research Council rankings, CRA made the arbitrary decision to place Pennsylvania in the second tier of schools.
3. All tables with rankings: Statistics sometimes are given according to departmental rank. Schools are ranked only if they offer a CS degree and according to the quality of their CS program as determined by reputation. Those that only offer CE degrees are not ranked, and statistics are given on a separate line, apart from the rankings.
4. All ethnicity tables: Ethnic breakdowns are drawn from guidelines set forth by the U.S. Department of Education.
5. All faculty tables: The survey makes no distinction between faculty specializing in CS vs. CE programs. Every effort is made to minimize the inclusion of faculty in electrical engineering who are not computer engineers.
Copyright © 2007 Computing Research Association. All Rights Reserved. Questions? E-mail: webmaster@cra.org.