THIS IS AN ARCHIVED VERSION OF CRA'S WEBSITE. THIS ARCHIVE IS AVAILABLE TO PROVIDE HISTORICAL CONTENT.
PLEASE VISIT HTTP://WWW.CRA.ORG FOR THE LATEST INFORMATION
| About CRA |
| Membership |
| CRA for Students |
| CRA for Faculty |
| CRA-Women |
| Computing Community Consortium (CCC) |
| Awards |
| Projects |
| Events |
| Jobs |
| Government Affairs |
| Computing Research Policy Blog |
| Publications |
| Data & Resources |
| CRA Bulletin |
| What's New |
| Contact |
| Home |

[Published originally in the May 2004 edition of Computing Research News, Vol. 16/No. 3, pp. 5-19.]
[This version of the article is meant for online viewing. Please use the PDF (335 KB) for printing.]
2002-2003 Taulbee Survey
Undergraduate Enrollments Drop; Department Growth Expectations Moderate
By Stuart Zweben and William Aspray
This article and the accompanying figures and tables present the results of the 33rd annual CRA Taulbee Survey1 of Ph.D.-granting departments of computer science (CS) and computer engineering (CE) in the United States and Canada. This survey is conducted annually by the Computing Research Association to document trends in student enrollment, employment of graduates, and faculty salaries.
Information was gathered during the fall of 2003. Responses received by December 10, 2003 are included in the analysis. The periods the data cover vary from table to table. Degree production (Ph.D., Master's, and Bachelor's) and total Bachelor's, Master's and Ph.D. enrollments refer to the previous academic year (2002-2003). Data for new students in all categories refer to the current academic year (2003-2004). Projected student production and information on faculty salaries and demographics also refer to the current academic year. Faculty salaries are those effective January 1, 2004.
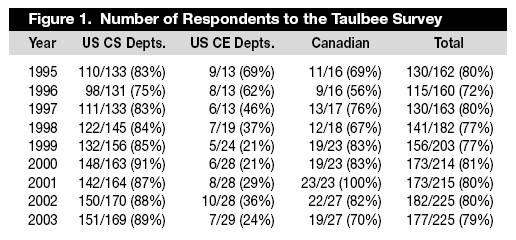
The data were collected from Ph.D.-granting departments only. A total of 225 departments were surveyed, the same number as last year. As shown in Figure 1, 177 departments returned their survey forms, for a response rate of 79 percent (compared to 80 percent last year). The return rate of 7 out of 29 (24%) for Computer Engineering (CE) programs is very low, as has been the case for several years (see below). We attribute this low response to two factors: 1) many CE programs are part of an ECE department, and they do not keep separate statistics for CE vs. EE; and 2) many of these departments are not aware of the Taulbee Survey or its importance. The response rate for US CS departments (151 of 169, or 89%) was very good, while the 70% response rate for Canadian programs was moderately good although not as good as in the past several years.
The set of departments responding varies slightly from year to year, even when the total numbers are about the same; thus, we must approach any trend analysis with caution. We must be especially cautious in using the data about CE departments because of the low response rate. However, we have reported CE departments separately because there are some significant differences between CS and CE departments.
The survey form itself is modified slightly each year to ensure a high rate of return (e.g., by simplifying and clarifying), while continuing to capture the data necessary to understand trends in the discipline and also reflect changing concerns of the computing research community. This year, preliminary survey results about faculty salaries were reported in December 2003 only to respondents. The CRA Board views this, and the release of this final report to respondents in early March 2004, as benefits of participation in the survey. We intend to continue this practice in future years.
This year we also included several new questions from the former Departmental Profiles Survey (see the section entitled “Additional Departmental Profiles Analysis”). We are especially pleased that the increased size of this year’s survey did not have a detrimental effect on the response rate. We thank all respondents who completed this year's questionnaire. Departments that participated are listed at the end of this article.
Ph.D. Degree Production and Enrollments (Tables 1-8)
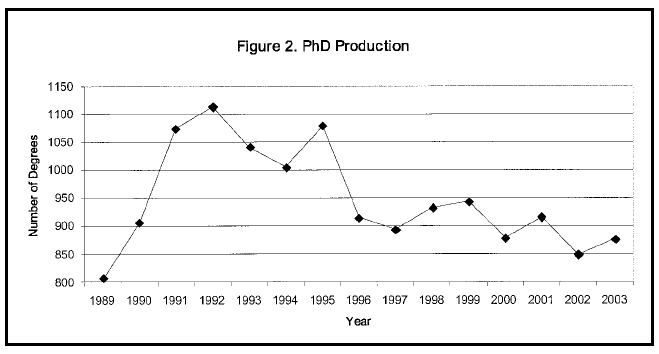
As shown in Table 1, a total of 877 Ph.D. degrees were awarded in 2003 by the 177 responding departments. This is an increase of 3% over last year, but still represents, as Figure 2 indicates, the second lowest total national Ph.D. production since 1989. Most likely this number is still reflecting the high-tech boom of the late 1990s when start-up companies presented an extremely attractive employment option for computer scientists.
The prediction from last year's survey that 1,224 Ph.D. degrees would be awarded in 2003 was, as usual, overly optimistic, with an "optimism" ratio, defined as the actual over the predicted, being 0.72. Given next year's prediction of 1,350 graduates (Table 1), we believe the actual number will be between 900 and 1,000.
Most of the other numbers indicate that doctoral students are staying in school and progressing towards the degree. The number entering Ph.D. programs (Table 5) decreased from 3,286 to 3,131 (5%), with this decrease entirely attributable to Canadian and CE respondents. The US CS numbers are flat. However, the number who passed qualifiers (Table 1) increased from 1,375 to 1,545 (12%). On a per-department basis, the number passing qualifiers has risen from 6.5 to 8.7 (33%) in three years. The number who passed thesis proposal exams (Table 1) stayed almost flat, changing from 884 to 881. Total Ph.D. enrollment (Table 6) increased from 10,021 to 12,007 (20%). It seems that the slow turn-around of the economy, and of the dot-com economy in particular, has attracted more people to graduate school in recent years, and more of them appear to be moving past at least the qualifier stage of the Ph.D. program.
Figure 3 shows a longer-term trend of the number of CS Ph.D. graduates, normalized by the number of departments responding to the Taulbee Survey. This graph also shows the number of new students entering Ph.D. programs and the number of students who passed qualifiers. These also are normalized for the number of departments reporting. The graph offsets the qualifier data by one year from the data for new students, and offsets the graduation data by five years from the data for new students, to approximate the lag between student entrance into the pipeline, and the qualifier and exit time frame for the same cohort. The figure suggests that, unless a larger fraction of those passing qualifiers do not complete the program, significant increases in Ph.D. production are only a few years away.
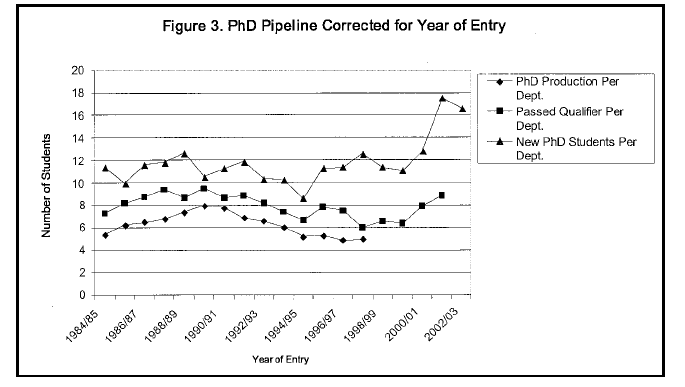
Table 4 shows employment for new Ph.D. recipients. Of those who reported employment domestically, 63% took academic employment (compared to 53% last year and 43% the year before). Most of these academic positions were in Ph.D.-granting departments, but 31 were in other CS/CE departments. This represents a considerable increase from the 9 reported last year as having gone to non-Ph.D.-granting CS/CE departments, but still likely falls considerably short of meeting the needs of those departments. There has also been a slight increase (from 83 to 89) in the number of postdoctoral positions (up from 56 two years ago). Figure 4 shows the trend of employment of new Ph.D.s to academia and industry, and the proportion of those going to academia who took positions other than in Ph.D-granting CS/CE departments. After many years of a decided preference for industry jobs over academic jobs, the trend during the most recent two years is striking, and indicative of economic conditions in industry. This has been good for Ph.D-granting CS/CE departments.
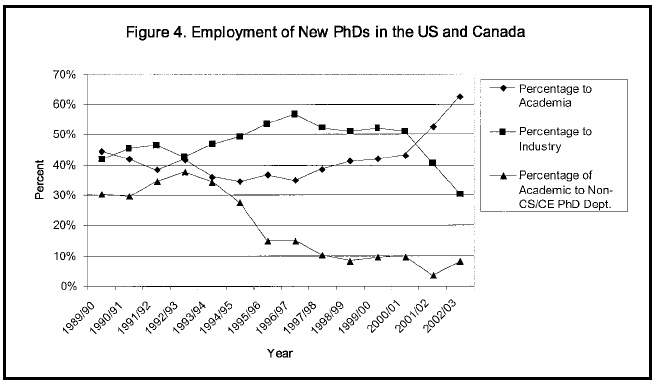
Table 4 also indicates increases in the proportion of new CS/CE Ph.D.s in the programming languages/compilers, OS/networks, software engineering, and graphics/HCI areas, while the AI/robotics, theory/algorithms, and database/information systems areas experienced a decreased proportion of Ph.D.s. Multi-year trends are less clear, though there appears to have been an increased production in the graphics/HCI and the numerical/scientific computing areas during the past five years.
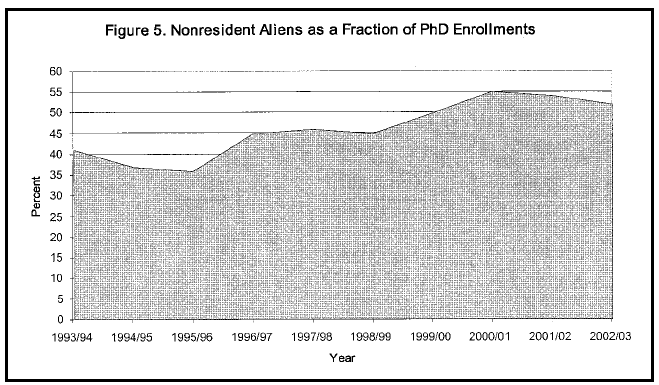
Most statistics on gender and ethnicity for Ph.D. students (Tables 2, 3, 7, 8) show little change from last year or, indeed, the last several years. White and nonresident-alien men continue to account for a very large fraction of our Ph.D. production and enrollments. Women represented 20% of enrollments, 17% of graduates. All other underrepresented groups make up a very small minority. As Figure 5 illustrates, we see a second year of slight decrease in the proportion of enrolled Ph.D. students who are nonresident aliens. The cause of this trend is unclear. It could be an increased interest in Ph.D. programs by domestic students, difficulties with visas for foreign students, or a perceived hostile environment that makes the United States seem less attractive to foreign students. Even with this two-year decline, the current proportion of non-resident aliens is the third highest in the past ten years. However, in 2003, the Educational Testing Service reports significant decreases in the number of students taking the GRE exam from countries that historically have been large feeders of North American graduate programs in CS/CE (especially China and India). The effect of this phenomenon on next year’s Taulbee data bears watching.
Master's and Bachelor's Degree Production and Enrollments (Tables 9-16)
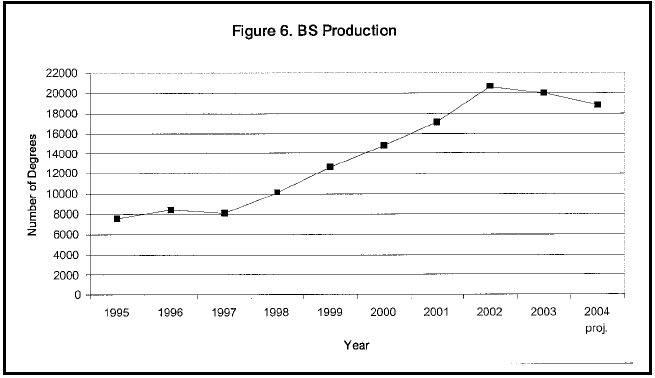
The statistics on Master's and Bachelor's degrees awarded show mixed trends. Master's degrees were awarded to 9,141 students, an increase of 15% (following a decrease of 4 percent the year before). This may be a byproduct of the increased enrollment trends in Ph.D. programs, since in many schools students obtain the M.S. on the way to the Ph.D. Actual Master’s degrees awarded exceeded last year’s projections by 17%. This year's expected Master's production (Table 12) exceeds the projection from last year's survey by 4 percent, but if met this still would represent a decrease of more than a 10% from last year’s actual production. Bachelor's degrees numbered 19,990, a decrease of 3% (following an increase of 21 percent the year before). Most of this decrease came from CE programs; CS production was down less than 2%, perhaps reflecting the residuals of the high growth in undergraduate program enrollment of the late 1990s. Actual Bachelor’s production was only about 1% less than projected last year. Projected Bachelor's production for this year shows a decrease from last year’s projections of 7 percent (see Figure 6).
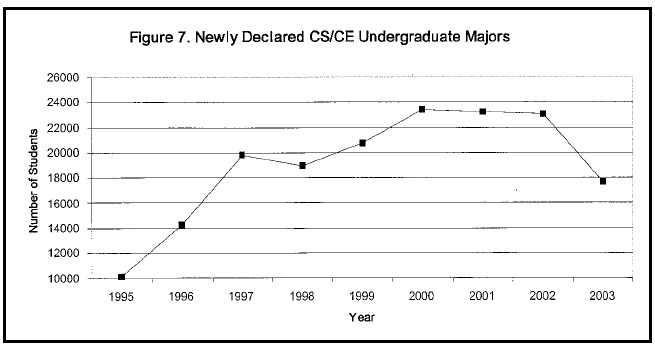
As shown in Figure 7, the number of new undergraduate majors dropped significantly from 23,033 to 17,706 (23%). For the previous three years, the number of new undergraduate students was approximately constant, whereas during the five years before that the number of new undergraduate students more than doubled. One major reason for this striking new trend is that the decline in the technology industry and the moving of jobs offshore are making computer science and engineering less alluring to new undergraduates. In addition, some programs have restricted admission to a subset of those desiring the computer science and engineering major, either by setting numerical limits or increasing the standards for admission. The selectivity of these programs has an impact on the number of students who want to compete for positions in these programs. Lastly, the introduction of new undergraduate programs in the IT field has created alternatives to the traditional CS and CE majors, possibly siphoning students who previously would have selected CS/CE programs. In any case, it is quite clear that the period of explosive growth in enrollments in Bachelor's programs is over.
In all other numbers, we again see mixed trends in both Bachelor's and Master's programs. New Master's students (Table 13) decreased by 8% after having decreased by 3% the previous year. This is further evidence of the effect of the dot-com crash, as fewer students seek degree programs designed mainly to prepare them for industry employment. Total enrollments in Bachelor's programs (Table 16) dropped by 19% (having increased in US CS departments by 4% to 5% and overall by 11% the previous year) and enrollments in Master's programs (Table 15) dropped by 4% (having increased by 21% the previous year).
Most demographics regarding gender and ethnicity for Bachelor's and Master's students show stability when compared with last year's results. The proportion of Master's degree recipients who are nonresident aliens (55.8%) is about the same as the previous year (Table 10).
Faculty Demographics (Tables 17-23)
Over the past year, the total number of faculty increased by 6 percent to a total of 5,831. Increases were shown in every category: tenure-track, researcher, postdoc, and teaching faculty.
Ph.D. production shows only 434 graduates taking faculty positions at CS/CE Ph.D-granting departments (Table 4). Tables 19 and 20 indicate that a total of 607 persons were hired during the past year. Thus, more than 70% of the faculty hires appear to have been new Ph.D.s, with the rest a combination of faculty who changed academic position, persons joining academia from government and industry, new Ph.D.s from disciplines outside of CS/CE, and non-Ph.D. holders (e.g., taking a teaching faculty appointment).
This year's observed faculty growth to 5,831 was very close to the prediction of 5,881 from last year's survey. Planned growth for this year is only 2% and only 5% for the following year. Departmental expectations appear to be much more modest and realistic than in previous years. This may reflect more firm numbers of open positions than in the days when several departments were reported to have an open-ended number of positions, and also may reflect an increased supply of candidates.
Table 23 on faculty "losses" shows that the same number of people (89, which is less than 2% of all faculty) actually left academia through death, retirement, or taking nonacademic positions this year and last year. However, this year, the amount of “churn,” the number of professors moving from one academic position to another, decreased from 108 to 74. Thus we have further evidence that the faculty "retention problem" that was so much discussed over the past few years seems to have solved itself.
The demographic data for faculty (Tables 19-22) show very small changes. Overall, the percentage of newly hired women faculty increased from 18% to 19%. The gender split of new faculty (81% male, 19% female) remains close to the split for new Ph.D. recipients (Table 2). While there are more newly hired men in tenure-track (82%) and research (86%) positions, these categories are slightly less male-dominated than they were the year before. The percentage of newly hired teaching faculty who are women dropped from 26% to 22%. These changes had no marked effect on the percentages of current faculty of each gender.
It is interesting to compare the ethnicity data for new faculty (Table 20) with that of Ph.D. recipients (Table 3). Forty-nine percent of the newly hired tenure-track faculty in Ph.D.-granting departments and 72% of the newly hired teaching faculty are white, non-Hispanic, even though only 37 percent of the Ph.D. recipients are in this category. By contrast, only 23 percent of the new faculty are nonresident aliens, whereas 43 percent of the degree recipients are in that category. Some new faculty could have become residents after receiving their Ph.D. degrees, but it seems clear that proportionately fewer foreign students take positions, especially teaching positions, at universities in North America.
Research Expenditures and Graduate Student Support (Tables 24-26)
Table 24 shows the department's total expenditure (including indirect costs or "overhead" as stated on project budgets) from external sources of support. As was true last year, the higher the ranking, the more external funding per capita, where capitation is computed relative to the number of tenured and tenure-track faculty members. Canadian levels are shown in Canadian dollars. The median per capita amount of support for schools in the 1-36 bands compared to the median reported in last year’s survey grew in the 5% to 10% range, while in the lower ranks, the median actually dropped by 3%. Canadian departments show a lower level of expenditures from external sources than every US ranking band; this stems, no doubt, from differences in the way that research is funded in Canada. It is difficult to draw meaning for the numbers for computer engineering because of the small number of departments reporting.
Table 25 shows the number of graduate students supported as full-time students as of fall 2003, further categorized as teaching assistants, research assistants, fellows, or computer systems supporters, and split between those on institutional vs. external funds. The higher the ranking of the department, the greater the proportion of graduate students who are supported on external funds (typically as research assistants and fully supported, externally funded fellows). Canadian departments are more likely than US departments to support their graduate students through teaching assistantships rather than research assistantships.
Respondents were asked to "provide the net amount (as of fall 2003) of an academic-year stipend for a graduate student (not including tuition or fees)." The results are shown in Table 26. Canadian stipends are shown in Canadian dollars. The higher the ranking band, the higher the median level of support for teaching assistants. Median amounts of support for research assistants at the top 24 schools also are much higher than those for the lower-ranked bands.
Faculty Salaries (Tables 27-34)
Each department was asked to report the minimum, median, mean, and maximum salaries for each rank (full, associate, and assistant professors and non-tenure-track teaching faculty) and the number of persons at each rank. The salaries are those in effect on January 1, 2004. For US departments, nine-month salaries are reported in US dollars. For Canadian departments, twelve-month salaries are reported in Canadian dollars. Respondents were asked to include salary supplements such as salary monies from endowed positions.
The minimum and maximum of the reported salary minima (and maxima) are self-explanatory. The range of salaries in a given rank among departments that reported data for that rank is the interval ["minimum of the minima," "maximum of the maxima"]. The mean of the reported salary minima (maxima) in a given rank is computed by summing the departmental reported minimum (maximum) and dividing by the number of departments reporting data at that rank.
The median salary at each rank is the middle of the list if you order its members’ mean salaries at that rank from lowest to highest, or the average of the middle two numbers if there is an even number of items in the set. The average salary at each rank is computed by summing the individual means reported at each rank and dividing by the number of departments reporting at that rank. We recognize that these means and medians are only approximations to the true means and medians for their rank.
U.S. average salaries increased between 1.9% and 2.5%, depending on tenure-track rank, and 1.4% for non-tenure teaching faculty. These increases are less than the 3% levels experienced last year. Canadian salaries (shown as 12-month salaries in Canadian dollars) decreased by 0.8% to 2.0%, depending on rank. This compares unfavorably to last year’s increase of 3.8% to 5.2% for different tenure-track categories; it may also reflect differences in the specific departments reporting, which has a more profound effect on Canadian results than on US results.
Median salaries for new Ph.D.s (those who received their Ph.D. last year and then joined departments as tenure-track faculty) were unchanged from those reported in last year’s survey (Table 34). This may help ease the salary compression and inversion experienced during the dot-com boom.
Additional Departmental Profiles Analysis
Every three years, CRA collects additional information about various aspects of departmental activities that are not expected to change much over a one-year period. These data used to be collected via a separate survey, called the Departmental Profiles Survey. The most recent data from this survey were published in the November 2000 issue of Computing Research News. Effective this year, the data from this survey will be collected as part of the Taulbee data collection cycle during those years when these data are due to be collected (next in fall of 2006). The data include teaching loads, sources of external funding, methods of recruiting graduate students, departmental support staff, and space. Where possible, we will compare this year’s results with the previous Profiles report. However, there is a much higher response rate from US CS departments to this year’s survey, particularly among higher-ranked departments, so comparisons with the previous survey should be interpreted with this in mind.
Teaching Loads (Tables 35-38)
Tables 35-38 discuss teaching loads in semester-length courses per year. The US departments ranked 1-12 have the lowest teaching loads, both officially and actually, with departments ranked 13-36 having slightly higher loads and other CS departments and CE departments having the highest loads. The Canadian departments have official loads that are similar to those of the US departments ranked in the top 36, but they seem to have less load reduction than the US departments so that their official and actual loads are about the same. Mean actual teaching loads in US CS departments ranked above 12 are slightly higher than those in the previous Profiles survey conducted in 2000, while official loads and median actual loads for these departments are about the same as they were in 2000. The actual and official load in the top 12 departments appears to be slightly lower now than in 2000.
Virtually all departments offer some possibility for load reduction, and the majority offer the possibility of load increase. Load reductions are widely available as parts of special packages for new faculty and for administrative duties (and universal among the CE departments that responded). About one-third of the departments offer reduction for type or size of class taught. Buy-out policies vary widely, with the US 1-12 ranked and the Canadian departments least willing to offer buyouts. The Canadian schools and the lower-ranked US departments are much more willing to give teaching load reduction for strong research involvement than the US schools ranked in the top 36. Increases in teaching load are mainly for faculty who are shifting their primary responsibilities to teaching. The responses from the US CS departments to this year’s questions about load reduction and increase are similar to those published in the 2000 Profiles report.
Sources of External Funding (Tables 39-44)
Tables 39-44 discuss sources of external funding. In US CS departments, NSF is the largest funder, consistent with the situation in 2000. Typically, NSF’s share now is twice or more as high as the next largest funders, generally DARPA or other defense agencies. Only small percentages of funding are received from NIH, DOE, state agencies, other mission-oriented federal agencies, or private foundations. Defense agencies such as ARO, AFOSR, and ONR provide a larger proportion of current funding for top 12 departments than they did in 2000, while NSF and DARPA provide a smaller proportion. For other US CS departments, NSF’s share is larger and DARPA’s is smaller than in 2000. Industry provides a larger share of funding in the top 12 departments, but a smaller share in other departments.
Median funding for US CS departments from each major source follow the ranking strata, with highest values for rank 1-12 departments, next highest values for departments ranked 13-24, and so on. Similarly, industrial funding makes up a much higher percentage of the funding in the US CS departments ranked 1-12 than in any other departments. CE departments tend to get slightly more funding from NSF than DARPA, and they receive higher percentages of funding from state agencies and industrial sources than most CS departments. Since only a small number of CE departments responded to the survey, care should be exercised when trying to generalize these observations to other CE departments. NSERC and the provincial agencies provide three-quarters of the Canadian support, with the next highest levels of support coming from industrial sources and other mission-oriented federal agencies. Actual funding amounts were not reported in the CRN article associated with the 2000 Profiles Survey.
Graduate Student Recruiting (Tables 45-47)
Earlier we presented the current status of graduate student stipends (see Table 26). We update these each year as part of the regular Taulbee Survey. The Profiles Survey asks about factors that affect these stipends, and this information is summarized in Table 45. For most US departments, stipend amounts are most frequently affected by advancement within the graduate program. Differences among the stipend source are important at many US CS departments, with years of service and recruiting enhancements being other factors in about a quarter of the departments. It is noteworthy that recruiting enhancements now are only a factor in about a quarter of the departments rather than about a third in 2000, while the other factors are present in the same proportion of departments as in 2000. In Canada, the most important factor influencing stipend amounts is the source of funds.
Table 46 shows methods used by departments to recruit graduate students, and Table 47 shows the costs associated with these methods. Most of the top 36 ranked departments use multi-year (typically 3 or 4 years) support guarantees as a recruiting tool, whereas less than half of the CE departments and departments ranked above 36 or unranked do so. The vast majority of the top-ranked departments also pay for graduate students to visit campus, which is much less common among the CE and other CS departments. Top-ranked US CS departments are also much more likely to enhance graduate student stipends than the other departments surveyed. Overall, 45% of the US CS departments had stipend enhancements in the 2000 survey, so this appears to be a much less prevalent tool than it was during the dot-com era. The typical enhancement is between $3,000 and $4,000 in the United States (about two-thirds the value for the 2000 survey) and $5,000 Canadian in Canada. The amount spent on paid visits to campus appears comparable to the value in 2000, and the amount of guaranteed summer support appears consistent with the general stipend increases over the three-year period since the last Profiles Survey.
Departmental Support Staff (Tables 48-50)
Tables 48-50 show various kinds of staff support provided to the department. Table 48 shows that the higher the ranking, the more full-time secretarial and administrative support the department has. Schools ranked 1-12 have more than four times as much support as the lower-ranked CS departments and 1.5 times as much support as a CE department. It may be more useful to normalize these data by the size of the department’s tenure-track faculty. If this is done, the top 12 departments and the CE departments have about 0.4 administrative support staff per faculty, departments ranked 13-36 about 0.3, and those ranked above 36 or unranked and the Canadian departments have about 0.2. For the US CS departments, these normalized values are less than they were in 2000. About 80% of funding for administrative support staff comes from institutional funds in the top 24 departments, and 90% or more comes from institutional funds in other departments.
The number of computer-support personnel employed by a CS department (Table 49) varies from a low of about 0.1 per tenure-track faculty for CE departments and US CS departments ranked above 36 or unranked, to slightly more than 0.2 per tenure-track faculty for US departments ranked 1-12 and for Canadian departments. Top-ranked departments are much more likely to support such positions with external funds (almost half of computer support personnel in the top 12 departments are paid from external funds, while only 10% to 20% of these personnel in Canadian departments, CE departments, and US departments ranked above 24 are supported by external funds).
Table 50 shows full-time research employees. US CE and Canadian CSE departments typically employ with internal funds five or six times as many full-time researchers as do US CS departments. US CS departments ranked in the top 24 have many more such positions than do the other departments, both in raw numbers and on a per FTE tenure-track faculty basis; they are mainly supported with external funds. Except for the top 12 departments, the ratios of research employees per FTE tenure-track faculty in US CS departments have declined since 2000.
Departmental Space (Tables 51-62)
Tables 51-62 illustrate a variety of space details. Table 51 lists total current departmental space. The amount of space held by a department varies widely, by a factor of almost 200 from smallest to largest space. Within the US CS departments, the average department ranked 1-12 has 1.5 times as much space per tenure-track faculty as the typical other CS department. Average values per tenure-track faculty in all US CS categories are below their corresponding values in the 2000 Profiles Survey, although in each stratum, actual average space has grown at least 10%. The actual amount of additional space per department increased about 5,000 sq. ft. from 2000 to 2003. In 2000, departments estimated that they would receive over 30,000 sq. ft. of new space by 2003. These differences may be explained by a combination of optimism on the part of the departments, and the fact that much of the new space ends up replacing existing space rather than adding to it. Canadian departments average about 10% to 20% below typical US CS departments. CE departments have the highest amount of space per FTE faculty (about 56% above the level for rank 1-12 US CS departments).
Tables 52-55 break down current space by category of space. The pattern in Table 51 for total department space is similar in Table 52 (space for faculty, staff, and student offices) and Table 53 (space for conference and seminar rooms). Table 54 shows that the CS departments ranked in the top 24 have substantially more research laboratory space than the other CS departments. On a per tenure-track faculty basis, the differences are not as great among the US CS departments, but Canadian departments appear to have only three-quarters the space per tenure-track faculty. CE departments have about three times as much research lab space per tenure-track faculty as do CS departments. Instructional lab space, shown in Table 55, is much greater for the top 12 ranked US CS departments and the Canadian departments than for other departments responding. However, several departments apparently do not have instructional lab space. In those departments that space is probably owned by their college or central campus offices, and in fact it is likely that many of the other departments have at least some of their instructional space provided by a more central university unit.
It is interesting to note that research lab space now is 27.7% of the total space, whereas in 2000 it was only 21.0%. All other categories of space are a somewhat smaller proportion of total space to compensate for this.
Tables 56-62 show space growth expectations. Table 56 indicates that only about half of the departments responding actually have definite plans for new space. This contrasts with an 81% figure in the 2000 survey. Table 57 shows when the space is expected to be added, Table 58 shows the total space expected, and Tables 59-62 break down these expected additions by category of space. Expected growth in office space accounts for the largest proportion (41.5%) of the total expected space growth, but this is a smaller proportion of office space than exists currently (50.9%). Each other category of space accounts for about a 3% higher proportion of the total planned space than it does as a proportion of current space.
Concluding Observations
This year, we see more conclusive data supporting reductions in undergraduate enrollments. This effect is observed in both the United States and Canada. While the reductions are significant, they should be interpreted in view of the staggering increases experienced in the late 1990s. Present enrollment levels are still considerably higher than before the surge during the dot-com era.
An upturn in the number of Ph.D.s produced appears to be on the horizon, absent exogenous forces. The multi-year increase in the number of students who passed qualifiers should soon have an effect on the number of graduates from Ph.D. programs. It will be interesting to see if this trend continues as economic conditions improve.
Faculty churn appears to be over, at least for the time being. Far fewer faculty moved from one academic position to another. Estimates of faculty growth are considerably more modest, and more accurate, than in previous years. Faculty salaries showed rather small increases compared with the recent past. These observations all are consistent with the economic downturn.
Some data from the former Departmental Profiles Survey showed differences, but much of it did not. This validates CRA’s decision to conduct the Profiles analysis only every 3 years (next in fall 2006). Of particular note is that high space growth is no longer forecast, consistent with the softening of faculty growth. Also, fewer departments appear to be offering special stipend enhancements as a means to recruit new graduate students.
Rankings
For tables that group computer science departments by rank, the rankings are based on information collected in the 1995 assessment of research and doctorate programs in the United States conducted by the National Research Council [see /statistics/nrcstudy2/home.html].
The top twelve CS departments in this ranking are: Stanford, Massachusetts Institute of Technology, University of California (Berkeley), Carnegie Mellon, Cornell, Princeton, University of Texas (Austin), University of Illinois (Urbana-Champaign), University of Washington, University of Wisconsin (Madison), Harvard, and California Institute of Technology. All schools in this ranking participated in the survey this year.
CS departments ranked 13-24 are: Brown, Yale, University of California (Los Angeles), University of Maryland (College Park), New York University, University of Massachusetts (Amherst), Rice, University of Southern California, University of Michigan, University of California (San Diego), Columbia, and University of Pennsylvania.2 All schools in this ranking participated in the survey this year.
CS departments ranked 25-36 are: University of Chicago, Purdue, Rutgers, Duke, University of North Carolina (Chapel Hill), University of Rochester, State University of New York (Stony Brook), Georgia Institute of Technology, University of Arizona, University of California (Irvine), University of Virginia, and Indiana. All schools in this ranking participated in the survey this year.
CS departments that are ranked above 36 or that are unranked that responded to the survey include: Arizona State University, Auburn, Boston, Brandeis, Case Western Reserve, City University of New York Graduate Center, Clemson, College of William and Mary, Colorado School of Mines, Colorado State, Dartmouth, DePaul, Drexel, Florida Institute of Technology, Florida International, Florida State, George Mason, George Washington, Georgia State, Illinois Institute of Technology, Iowa State, Johns Hopkins, Kansas State, Kent State, Lehigh, Louisiana State, Michigan State, Michigan Technological, Mississippi State, Montana State, New Jersey Institute of Technology, New Mexico State, North Carolina State, North Dakota State, Northeastern, Northwestern, Oakland, Ohio, Ohio State, Oklahoma State, Old Dominion, Oregon Health & Science, Oregon State, Pennsylvania State, Polytechnic, Portland State, Rensselaer Polytechnic, Southern Methodist, State University of New York (Albany), Syracuse, Texas A&M, Texas Tech, Tufts, Utah State, Vanderbilt, Virginia Commonwealth, Virginia Polytechnic, Washington State, Washington (St. Louis), Wayne State, Western Michigan, Worcester Polytechnic, and Wright State.
University of: Alabama (Birmingham, Huntsville, and Tuscaloosa), Buffalo, California (at Davis, Riverside, Santa Barbara, and Santa Cruz), Cincinnati, Colorado (at Boulder, Colorado Springs, and Denver), Connecticut, Delaware, Denver, Florida, Georgia, Hawaii, Houston, Idaho, Illinois (Chicago), Iowa, Kansas, Kentucky, Louisiana (Lafayette), Louisville, Maine, Maryland (Baltimore Co.), Massachusetts (at Boston and Lowell), Minnesota, Missouri (at Kansas City and Rolla), Nebraska (Lincoln), Nevada (Las Vegas), New Hampshire, New Mexico, North Texas, Notre Dame, Oklahoma, Oregon, Pittsburgh, South Carolina, South Florida, Tennessee (Knoxville), Texas (at Arlington, Dallas, El Paso, and San Antonio), Tulsa, Utah, and Wyoming.
Computer Engineering departments participating in the survey this year include: Georgia Institute of Technology, Northwestern, Princeton, Rensselaer Polytechnic, Santa Clara University, the University of Tennessee (Knoxville), and the University of California (Santa Cruz).
Canadian departments participating in the survey include: Concordia, Dalhousie, McGill, Memorial, Queen's, Simon Fraser, and York universities. University of: Alberta, British Columbia, Calgary, Manitoba, Montreal, New Brunswick, Quebec (Montreal), Regina, Saskatchewan, Victoria, Waterloo, and Western Ontario.
Acknowledgments
Jean Smith and Drew Sutter assisted with data collection, tabulation, and analysis for this survey. Andy Bernat and Jay Vegso helped with the preparation of the final report. We thank them for their assistance.
Stuart Zweben (zweben [at] cis.ohio-state.edu), Ohio State
University
William Aspray (waspray [at] indiana.edu), Indiana University
Endnotes
1. The title of the survey honors the late Orrin E. Taulbee of the University of Pittsburgh, who conducted these surveys for the Computer Science Board until 1984, with retrospective annual data going back to 1970.
2. Although the University of Pennsylvania and the University of Chicago were tied in the National Research Council rankings, CRA made the arbitrary decision to place Pennsylvania in the second tier of schools.
All tables with rankings: Statistics sometimes are given according to departmental rank. Schools are ranked only if they offer a CS degree and according to the quality of their CS program as determined by reputation. Those that only offer CE degrees are not ranked, and statistics are given on a separate line, apart from the rankings.
All ethnicity tables: Ethnic breakdowns are drawn from guidelines set forth by the U.S. Department of Education.
All faculty tables: The survey makes no distinction between faculty specializing in CS vs. CE programs. Every effort is made to minimize the inclusion of faculty in electrical engineering who are not computer engineers.
Copyright © 2007 Computing Research Association. All Rights Reserved. Questions? E-mail: webmaster@cra.org.