THIS IS AN ARCHIVED VERSION OF CRA'S WEBSITE. THIS ARCHIVE IS AVAILABLE TO PROVIDE HISTORICAL CONTENT.
PLEASE VISIT HTTP://WWW.CRA.ORG FOR THE LATEST INFORMATION
| About CRA |
| Membership |
| CRA for Students |
| CRA for Faculty |
| CRA-Women |
| Computing Community Consortium (CCC) |
| Awards |
| Projects |
| Events |
| Jobs |
| Government Affairs |
| Computing Research Policy Blog |
| Publications |
| Data & Resources |
| CRA Bulletin |
| What's New |
| Contact |
| Home |
Back to January 2003 CRN Table of Contents
[Published originally in the January 2003 edition of Computing Research News, Vol. 15/No. 1, pp.4-5.]
2001-2002 Preliminary Taulbee Data on Faculty Salaries
By Moshe Y. Vardi, Timothy Finin, and Thomas Henderson
Each September the Computing Research Association surveys academic departments in the United States and Canada that offer the Ph.D. in computer science or computer engineering. The annual CRA Taulbee Survey collects data on the enrollment in the undergraduate, master's, and Ph.D. computing programs; the employment of Ph.D. graduates of these programs; and the number and salaries of faculty in these programs.
This is the 32nd year that CRA has tracked the production and employment of Ph.D.s in the computer science field. For the past 16 years, computer engineering data have also been incorporated into the survey. The traditionally high response rate to the survey makes the data especially useful; the data are used widely, not only by CRA's members but also by other organizations and institutions.
Each January, as a service to our members, CRA publishes a preliminary report of the survey's faculty salary data. We believe these preliminary results comprise enough data to be valuable and valid as tools for planning for the spring faculty-recruiting season. The full survey results--including updated salary data; enrollment, production, and employment data; and trend analyses--will appear in the March 2003 issue of CRN.
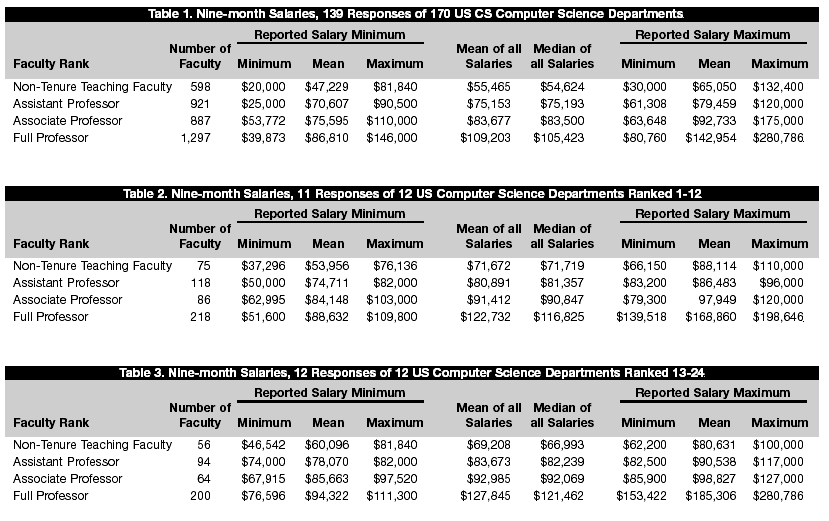
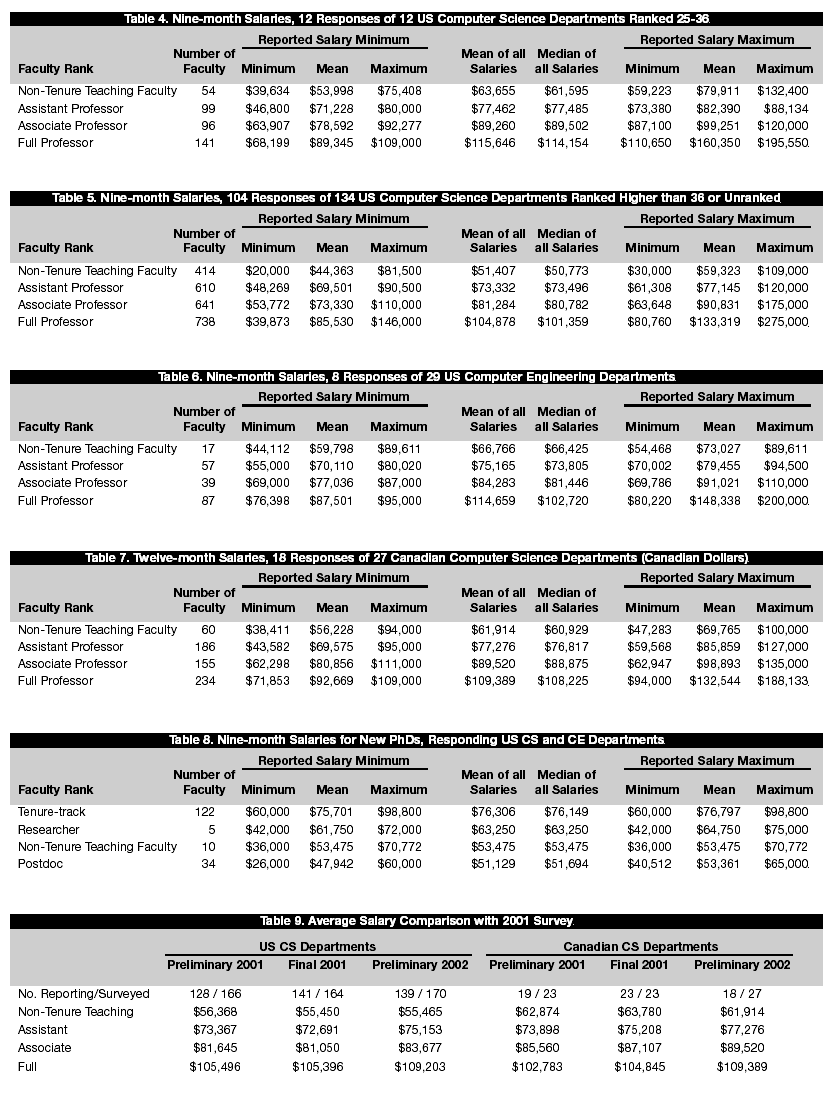
Tables 1 through 9 show the results in a format comparable to that used in previous CRA surveys. We have included the data for computer engineering departments (Table 6), although the low return rate (8 responses of 29) reduces their reliability. In the tables that group the departments by rank, the groupings are based on the 1993 National Research Council ranking of research-doctorate programs in the United States, released in 1995 (/statistics/nrcstudy2/).
Each department was asked to report the minimum, median, mean, and maximum salaries for each rank (full, associate, and assistant professors and non-tenure-track teaching faculty) and the number of persons at each rank. The salaries are those in effect on January 1, 2003. For U.S. departments, nine-month salaries are reported in U.S. dollars. For Canadian departments, twelve-month salaries are reported in Canadian dollars. Respondents were asked to include salary supplements such as salary monies from endowed positions.
The minimum and maximum of the reported salary minima (and maxima) are self-explanatory. The range of salaries in a given rank among departments that reported data for that rank is the interval ["minimum of the minima," "maximum of the maxima"]. The mean of the reported salary minima (maxima) in a given rank is computed by summing the departmental reported minimum (maximum) and dividing by the number of departments reporting data at that rank. The median salary at each rank is the middle of the list if you order its members from lowest to highest, or the average of the middle two numbers if there is an even number of items in the set. The average salary at each rank is computed by summing the individual means reported at each rank and dividing by the number of departments reporting at that rank.
For comparison with last year's data, Table 9 shows, separately, the overall average computer science salaries for U.S. departments and for Canadian departments. The preliminary data from 2001 are those published in the January 2002 CRN, and the final data from 2001 are those published in the March 2002 CRN.
When compared with the final 2000-2001 data, the U.S. preliminary average salaries have increased by:
- 0.0 percent (6.8 last year) for non-tenure-track teaching faculty;
- 3.4 percent (5.9 last year) for assistant professors;
- 3.0 percent (5.3 last year) for associate professors; and
- 3.6 percent (5.7 last year) for full professors.
Canadian preliminary average salaries have increased/decreased by:
- -3.0 percent (20 percent* last year) for non-tenure-track teaching faculty;
- 2.7 percent (7.4 last year) for assistant professors;
- 2.8 percent (5.1 last year) for associate professors; and
- 4.3 percent (6.1 last year) for full professors.
[*The large (20 percent) increase reported last year for non-tenure-track teaching faculty in Canada is due in part to one relatively high salary reported. If that figure is excluded from the calculation, the increase was still substantial at 13 percent.]
Tables 2, 3, and 4 report the data for the same set of schools reporting last year. In the group of U.S. computer science departments ranked 1 through 36, the average salaries for tenure-track faculty increases ranged from a low of 1.3 percent (for associate professors in departments ranked 13-24 and for full professors in those ranked 25-36) to a high of 5.7 percent (for associate professors in those ranked 25-36). The average increase was 3.4 percent.


The Taulbee Survey Committee members include Moshe Y. Vardi (Rice University), Chair; Timothy Finin (UMBC); and Thomas Henderson (University of Utah).
Copyright © 2007 Computing Research Association. All Rights Reserved. Questions? E-mail: webmaster@cra.org.
